Skills / examples

Reflex XY · Capability atlas · v0.0.8

One chart toolkit.
Explore its range.

From individual points to distributions, fields, flows and polar geometry. Explore actual XY exports in two color sets, then open the code and make them your own.

Showing 114 charts. Open one interactive chart at a time.

Core marks

Core marks · CS1

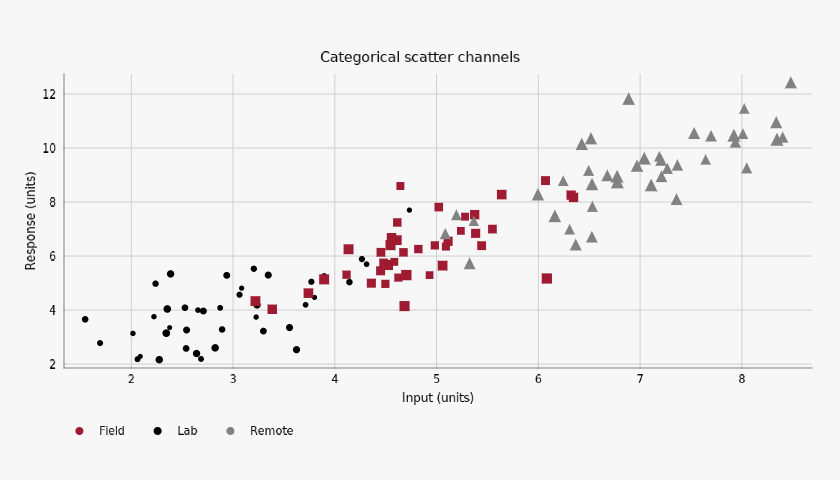
Categorical scatter channels

#

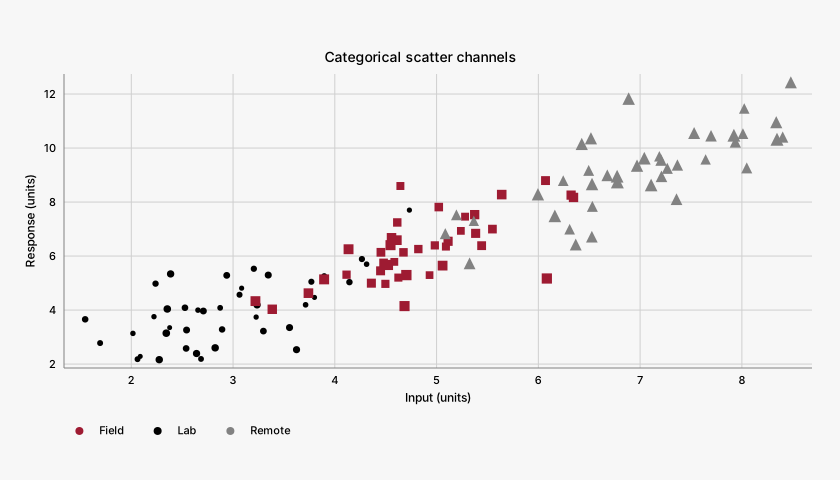
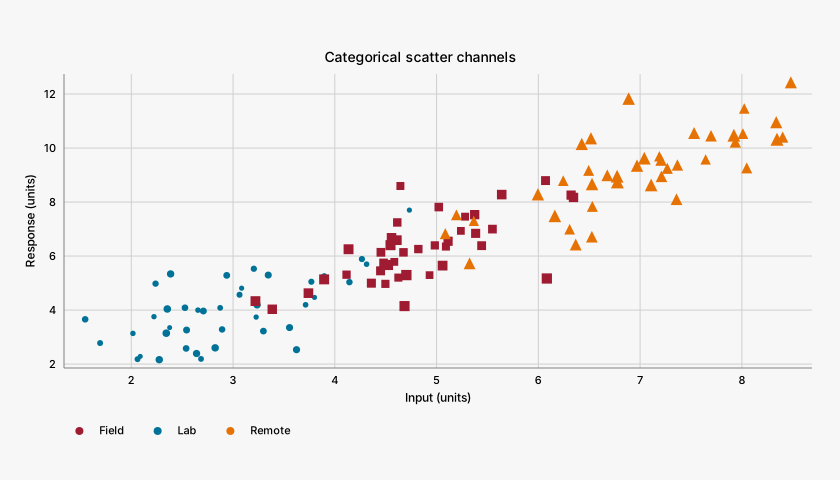
Named columns bind category color and a numeric size channel.

Categorical scatter channels, colorset1
Exact palette paintscartesian
Options and implementation

The theme cycle colors sorted cohort labels. Symbols repeat the same distinction; opaque fills retain exact palette paints.

xy.scatterxy.scatter_chart

{
  "scatter": [
    "data",
    "color",
    "size",
    "size_range",
    "symbol",
    "opacity",
    "density"
  ]
}
Core marks · CS2

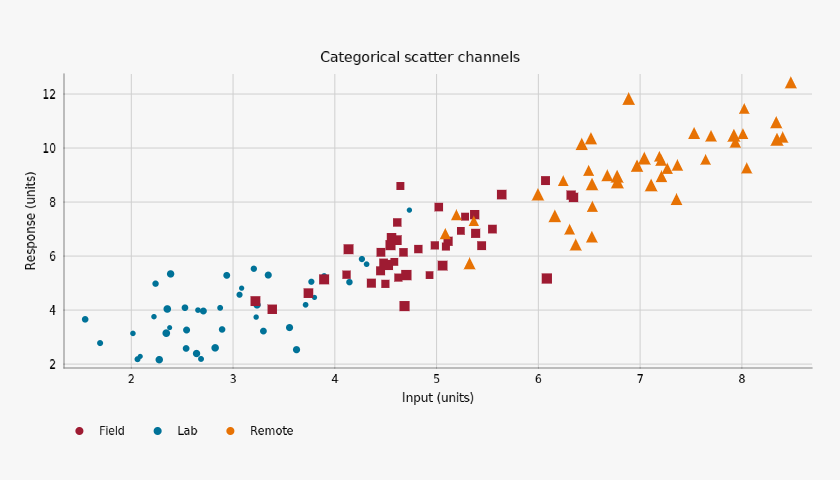
Categorical scatter channels

#

Named columns bind category color and a numeric size channel.

Categorical scatter channels, colorset2
Exact palette paintscartesian
Options and implementation

The theme cycle colors sorted cohort labels. Symbols repeat the same distinction; opaque fills retain exact palette paints.

xy.scatterxy.scatter_chart

{
  "scatter": [
    "data",
    "color",
    "size",
    "size_range",
    "symbol",
    "opacity",
    "density"
  ]
}
Core marks · CS1

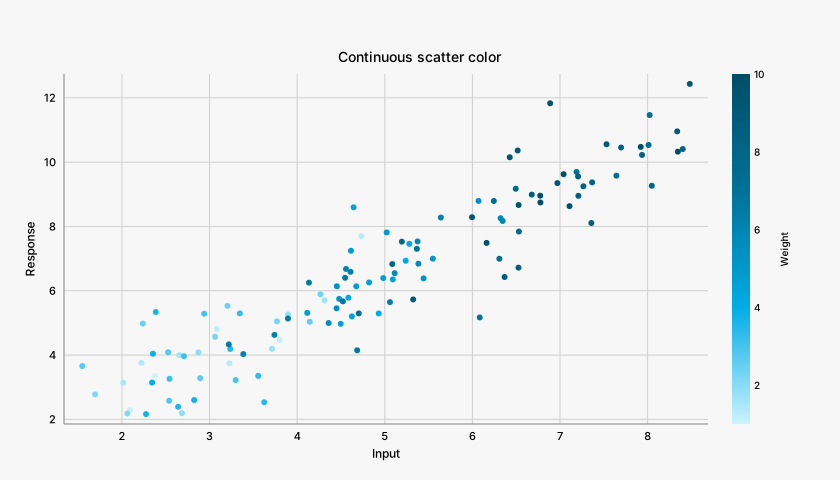
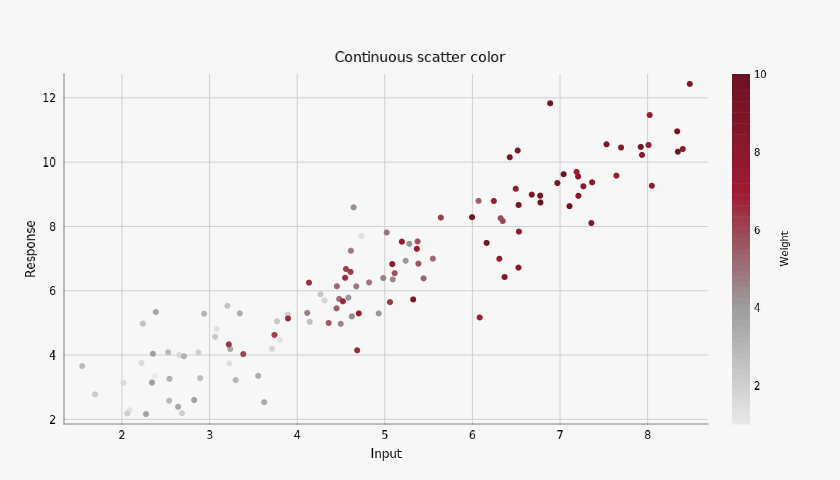
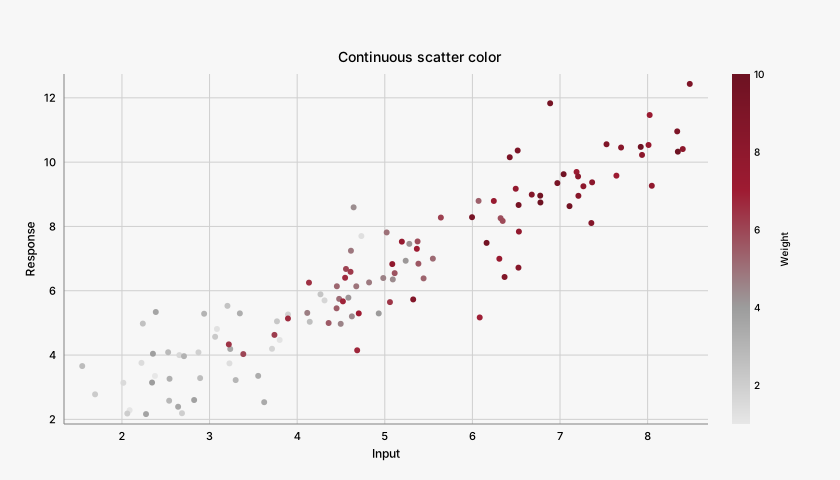
Continuous scatter color

#

A numeric color channel uses an explicit palette-derived scale.

Continuous scatter color, colorset1
Renderer-derived tonescartesian
Options and implementation

Magnitude maps through canonical ramp stops. XY interpolates intermediate quantitative shades; these derived paints are intentional.

xy.scatterxy.scatter_chartxy.colorbar

{
  "scatter": [
    "color",
    "colormap",
    "color_domain",
    "size",
    "opacity",
    "density"
  ],
  "colorbar": [
    "title"
  ]
}
Core marks · CS2

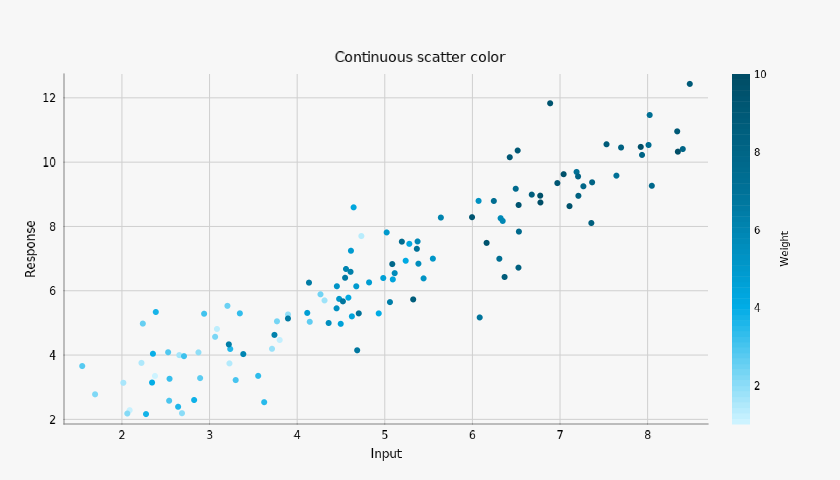
Continuous scatter color

#

A numeric color channel uses an explicit palette-derived scale.

Continuous scatter color, colorset2
Renderer-derived tonescartesian
Options and implementation

Magnitude maps through canonical ramp stops. XY interpolates intermediate quantitative shades; these derived paints are intentional.

xy.scatterxy.scatter_chartxy.colorbar

{
  "scatter": [
    "color",
    "colormap",
    "color_domain",
    "size",
    "opacity",
    "density"
  ],
  "colorbar": [
    "title"
  ]
}
Core marks · CS1

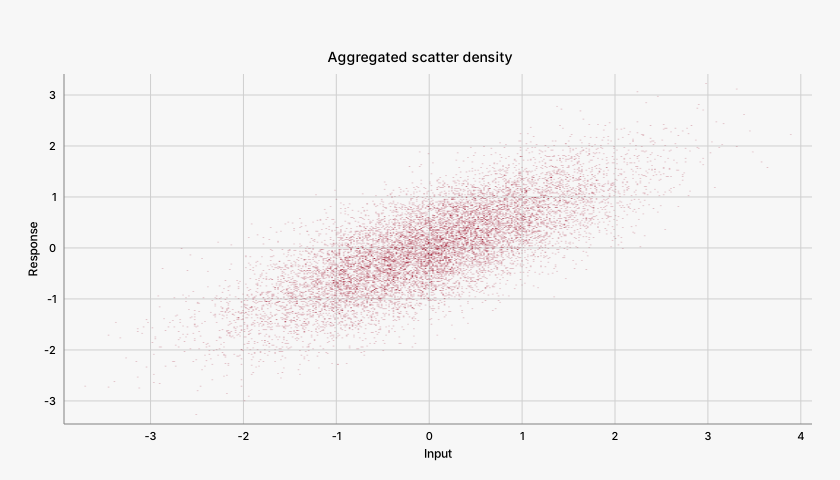
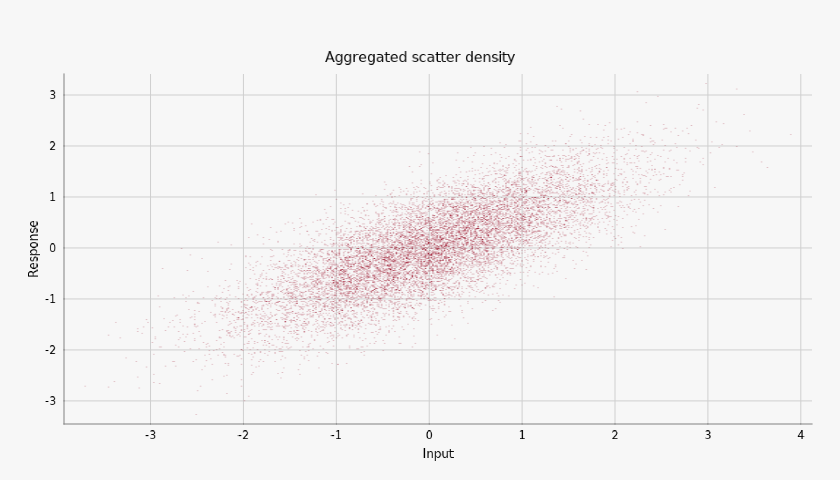
Aggregated scatter density

#

12,000 observations use XY's native density representation.

Aggregated scatter density, colorset1
Renderer-derived tonescartesian
Options and implementation

density=True aggregates observations. Concentration derives tones from one canonical tint; each density pixel summarizes a bin.

xy.scatterxy.scatter_chart

{
  "scatter": [
    "color",
    "density",
    "opacity"
  ]
}
Core marks · CS2

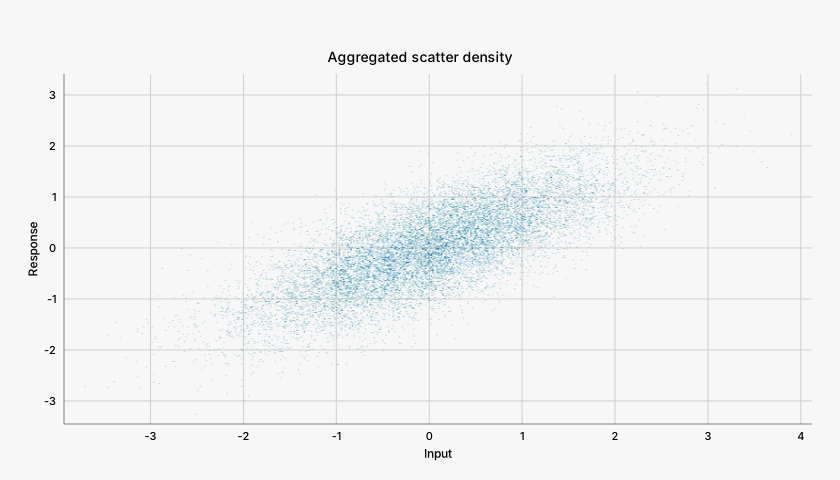
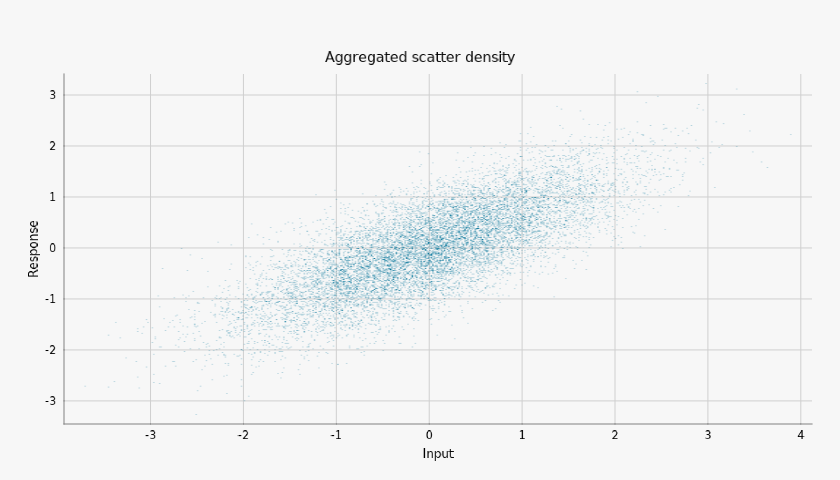
Aggregated scatter density

#

12,000 observations use XY's native density representation.

Aggregated scatter density, colorset2
Renderer-derived tonescartesian
Options and implementation

density=True aggregates observations. Concentration derives tones from one canonical tint; each density pixel summarizes a bin.

xy.scatterxy.scatter_chart

{
  "scatter": [
    "color",
    "density",
    "opacity"
  ]
}
Core marks · CS1

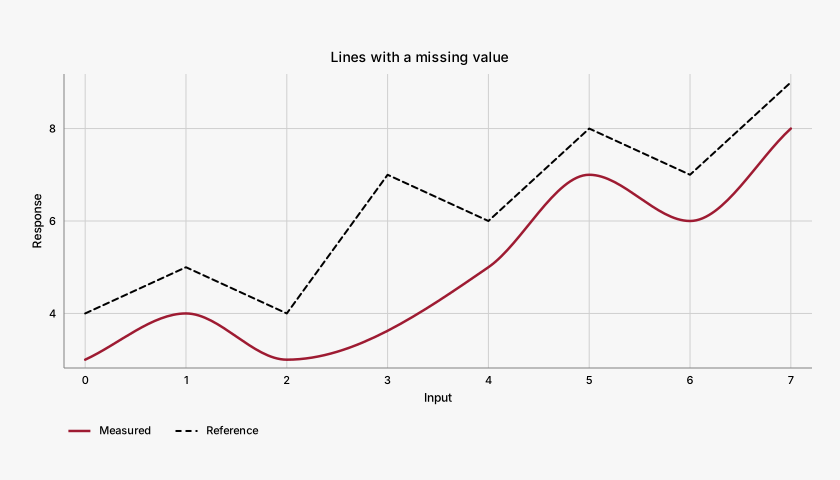
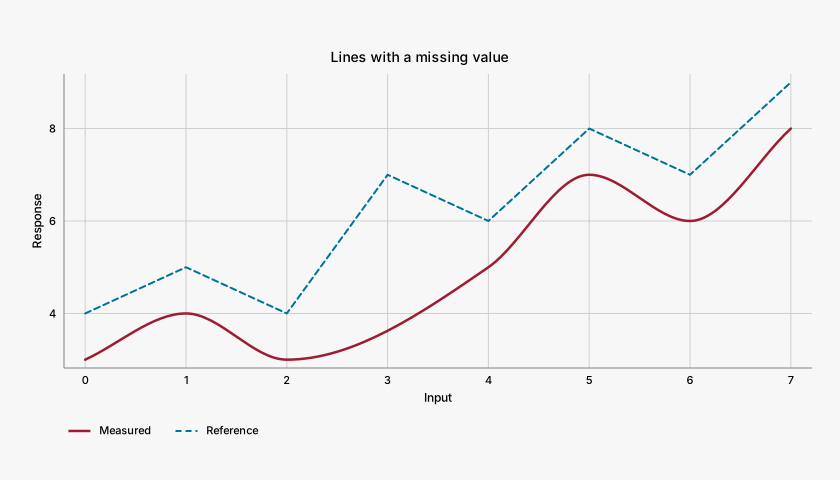
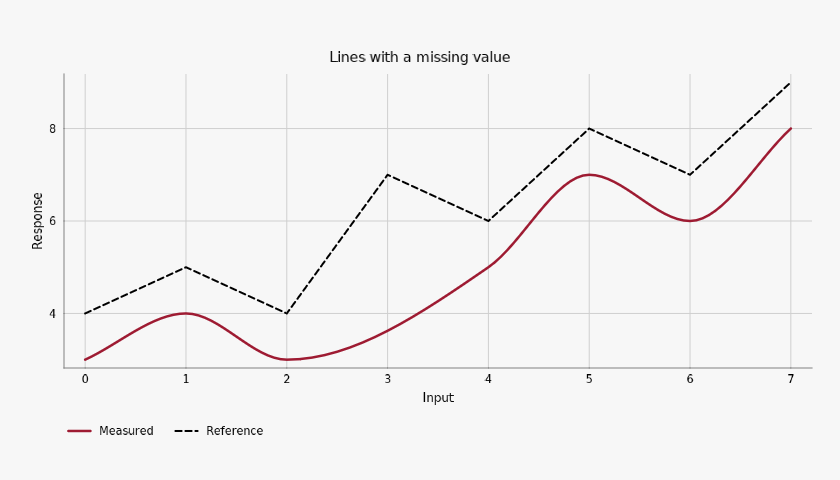
Lines with a missing value

#

Smooth and dashed series retain an explicit missing observation.

Lines with a missing value, colorset1
Exact palette paintscartesian
Options and implementation

NaN breaks a run. Each line owns a constant color, width, and interpolation rule.

xy.linexy.line_chart

{
  "line": [
    "color",
    "curve",
    "width",
    "name",
    "dash"
  ]
}
Core marks · CS2

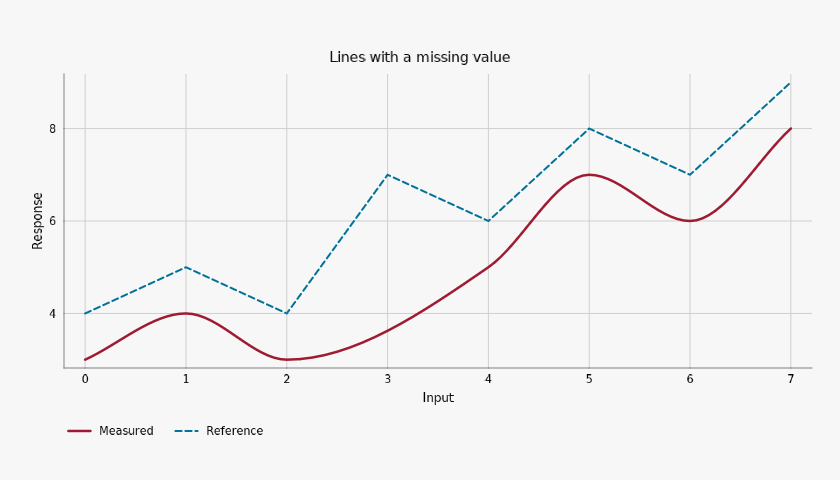
Lines with a missing value

#

Smooth and dashed series retain an explicit missing observation.

Lines with a missing value, colorset2
Exact palette paintscartesian
Options and implementation

NaN breaks a run. Each line owns a constant color, width, and interpolation rule.

xy.linexy.line_chart

{
  "line": [
    "color",
    "curve",
    "width",
    "name",
    "dash"
  ]
}
Core marks · CS1

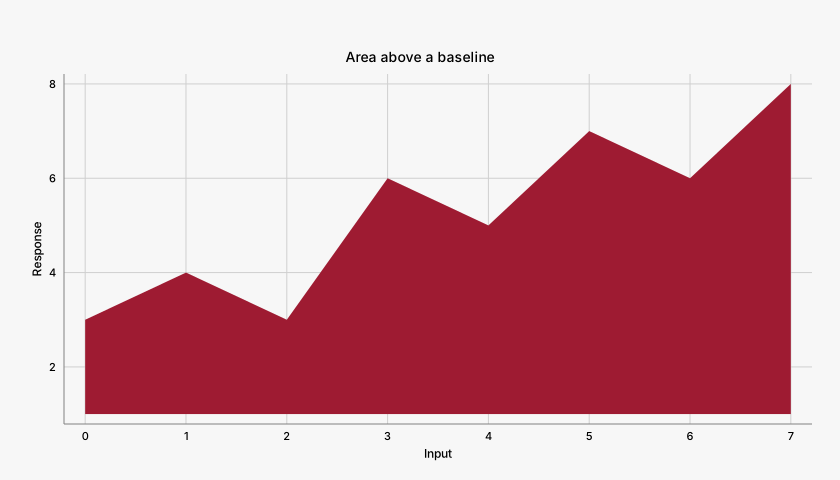
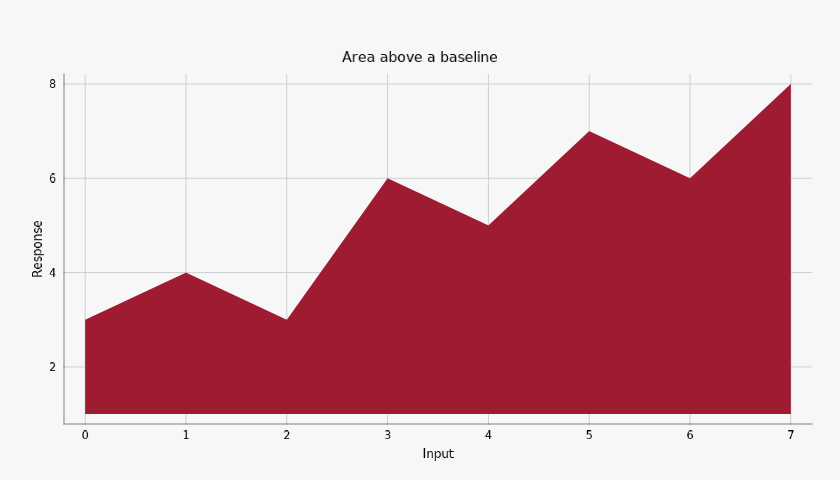
Area above a baseline

#

An opaque area fills the interval between a series and its baseline.

Area above a baseline, colorset1
Exact palette paintscartesian
Options and implementation

base is a data value, not an opacity setting. The outline is disabled explicitly so the solid fill carries the region.

xy.areaxy.area_chart

{
  "area": [
    "base",
    "color",
    "opacity",
    "line_width"
  ]
}
Core marks · CS2

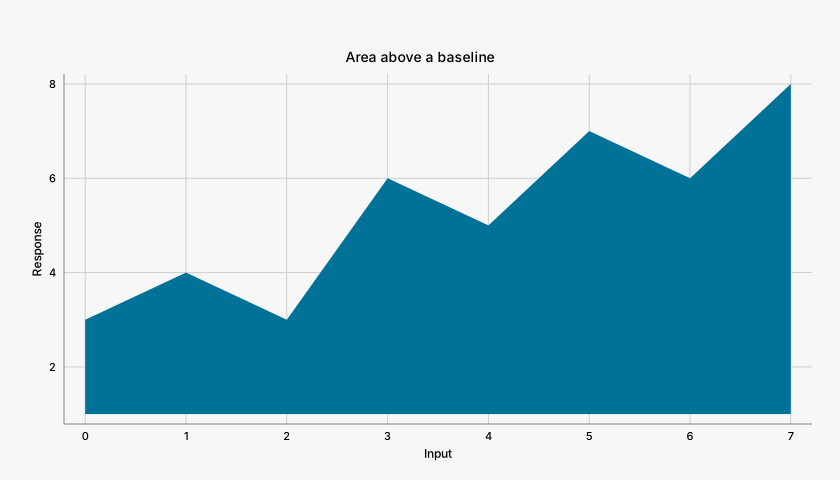
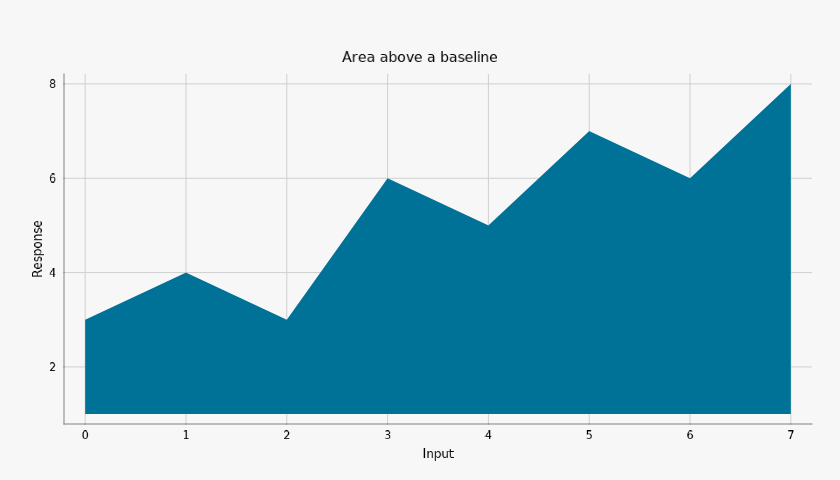
Area above a baseline

#

An opaque area fills the interval between a series and its baseline.

Area above a baseline, colorset2
Exact palette paintscartesian
Options and implementation

base is a data value, not an opacity setting. The outline is disabled explicitly so the solid fill carries the region.

xy.areaxy.area_chart

{
  "area": [
    "base",
    "color",
    "opacity",
    "line_width"
  ]
}
Core marks · CS1

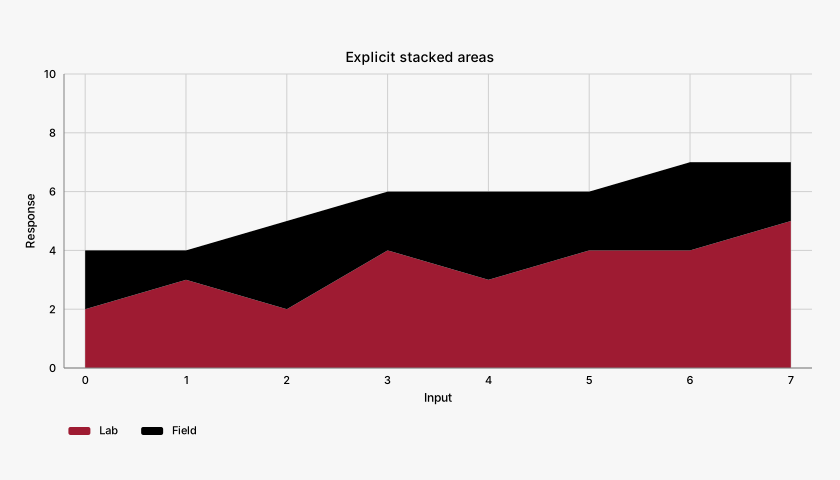
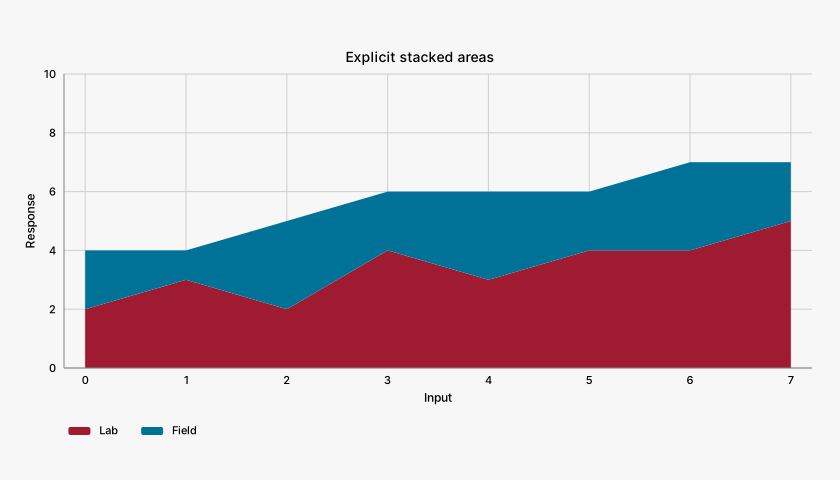
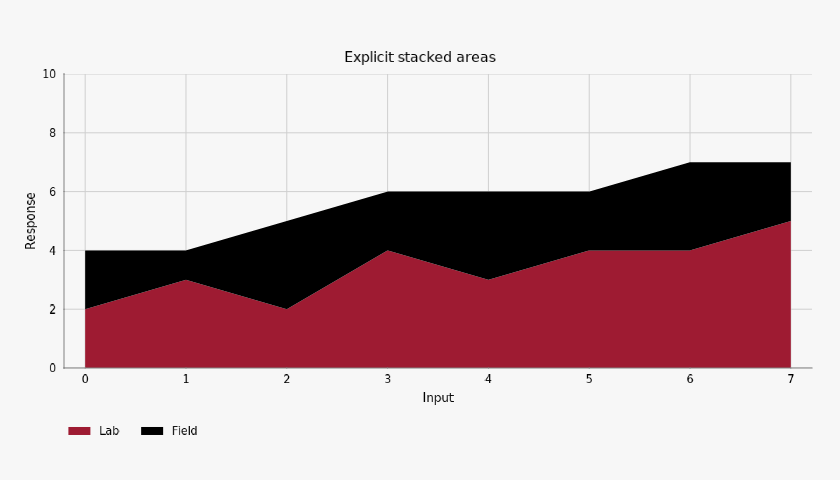
Explicit stacked areas

#

Two areas share a cumulative boundary computed from aligned arrays.

Explicit stacked areas, colorset1
Exact palette paintscartesian
Options and implementation

The upper layer uses base=lower and y=lower+upper. Area y is an endpoint; bar y uses a height. These contracts differ.

xy.areaxy.area_chart

{
  "area": [
    "base",
    "color",
    "opacity",
    "line_width",
    "name"
  ]
}
Core marks · CS2

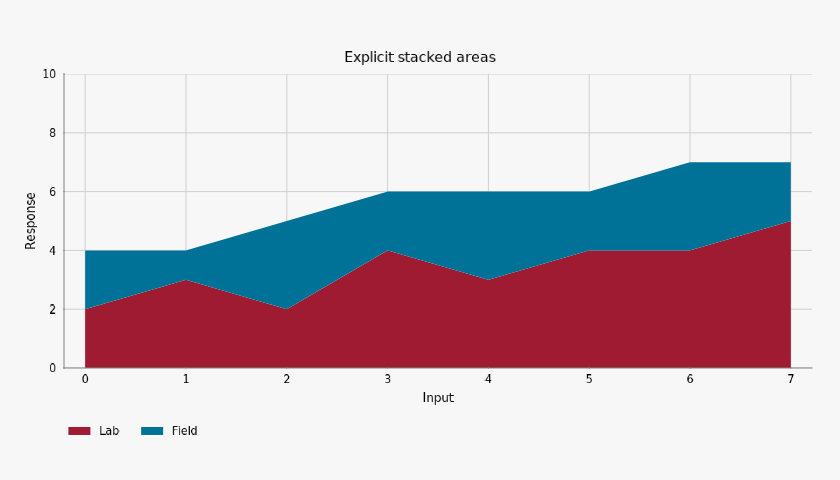
Explicit stacked areas

#

Two areas share a cumulative boundary computed from aligned arrays.

Explicit stacked areas, colorset2
Exact palette paintscartesian
Options and implementation

The upper layer uses base=lower and y=lower+upper. Area y is an endpoint; bar y uses a height. These contracts differ.

xy.areaxy.area_chart

{
  "area": [
    "base",
    "color",
    "opacity",
    "line_width",
    "name"
  ]
}
Core marks · CS1

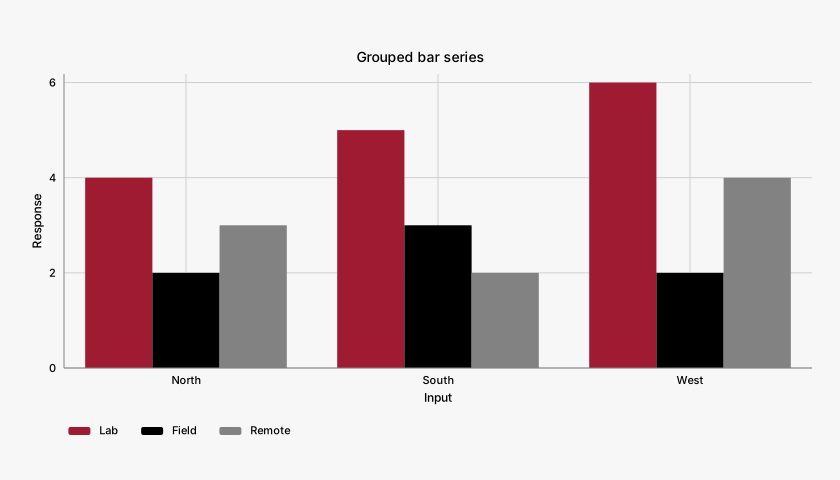
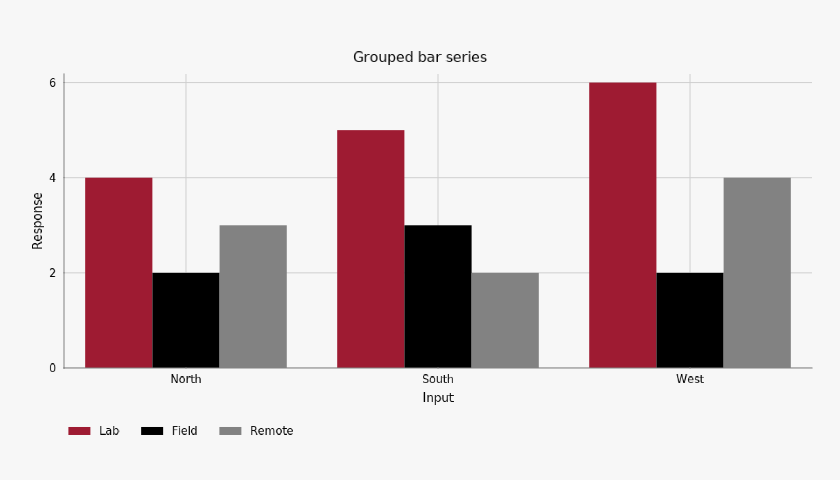
Grouped bar series

#

Series sit beside one another within each category.

Grouped bar series, colorset1
Exact palette paintscartesian
Options and implementation

A series-by-category matrix and explicit names keep color alignment stable. mode controls the layout.

xy.barxy.bar_chart

{
  "bar": [
    "series",
    "colors",
    "mode",
    "opacity"
  ]
}
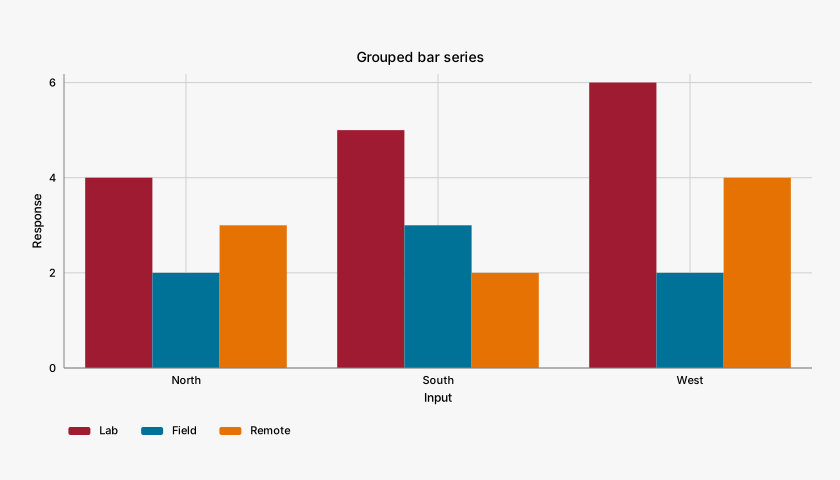
Core marks · CS2

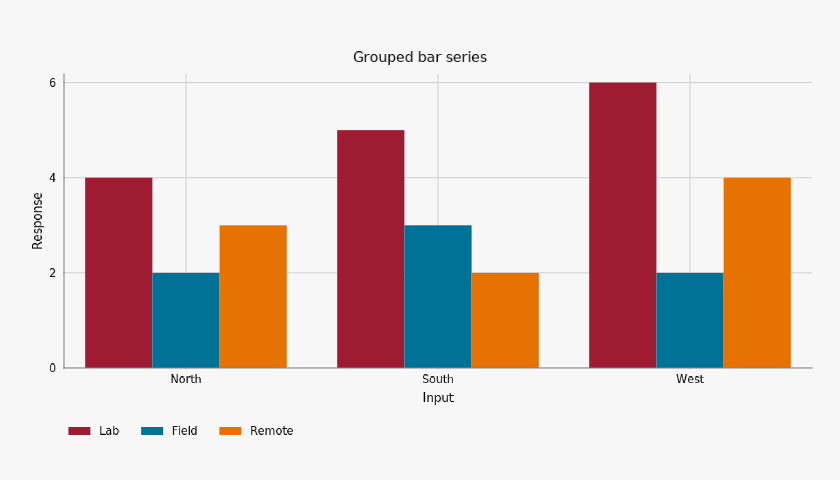
Grouped bar series

#

Series sit beside one another within each category.

Grouped bar series, colorset2
Exact palette paintscartesian
Options and implementation

A series-by-category matrix and explicit names keep color alignment stable. mode controls the layout.

xy.barxy.bar_chart

{
  "bar": [
    "series",
    "colors",
    "mode",
    "opacity"
  ]
}
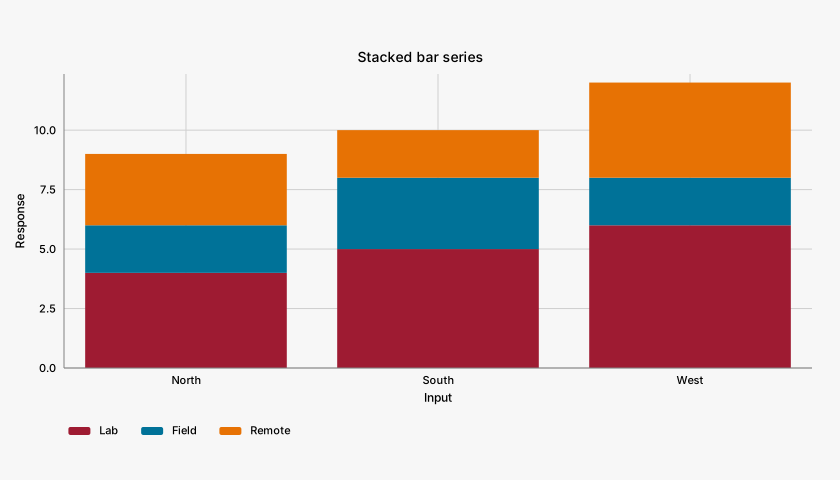
Core marks · CS1

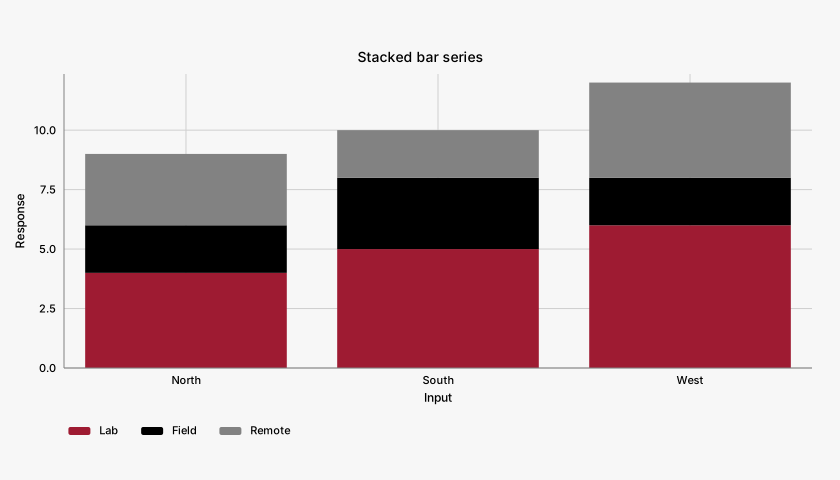
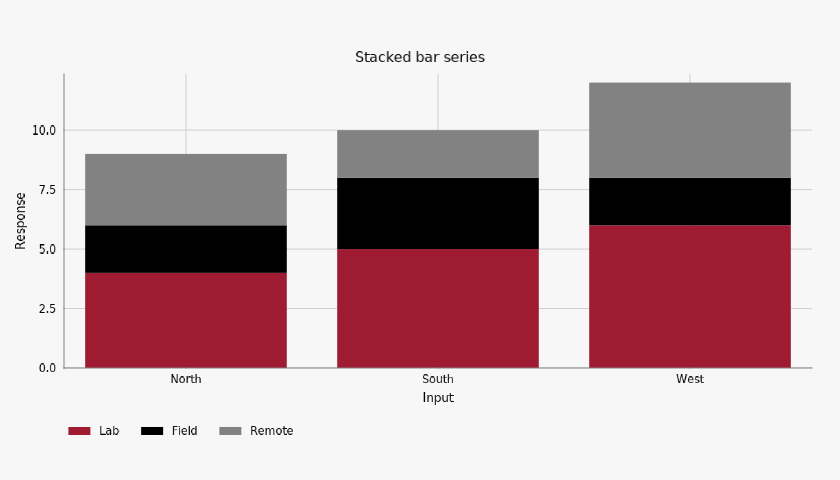
Stacked bar series

#

Series stack their heights from a shared zero baseline.

Stacked bar series, colorset1
Exact palette paintscartesian
Options and implementation

A series-by-category matrix and explicit names keep color alignment stable. mode controls the layout.

xy.barxy.bar_chart

{
  "bar": [
    "series",
    "colors",
    "mode",
    "opacity"
  ]
}
Core marks · CS2

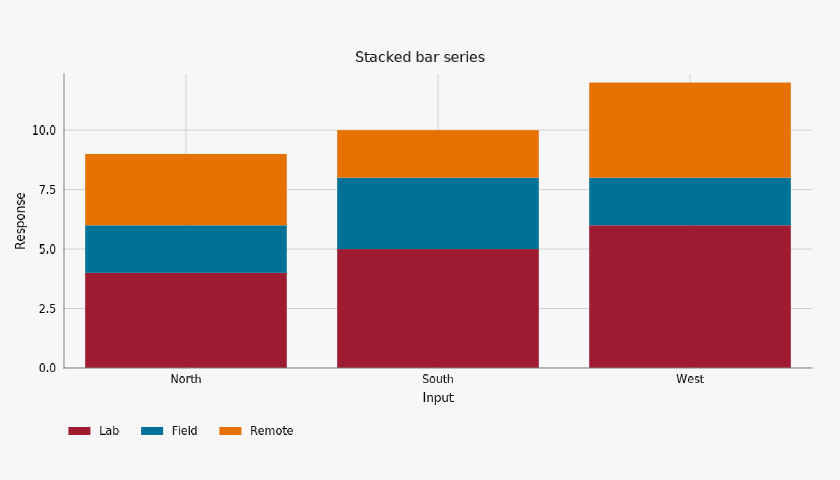
Stacked bar series

#

Series stack their heights from a shared zero baseline.

Stacked bar series, colorset2
Exact palette paintscartesian
Options and implementation

A series-by-category matrix and explicit names keep color alignment stable. mode controls the layout.

xy.barxy.bar_chart

{
  "bar": [
    "series",
    "colors",
    "mode",
    "opacity"
  ]
}
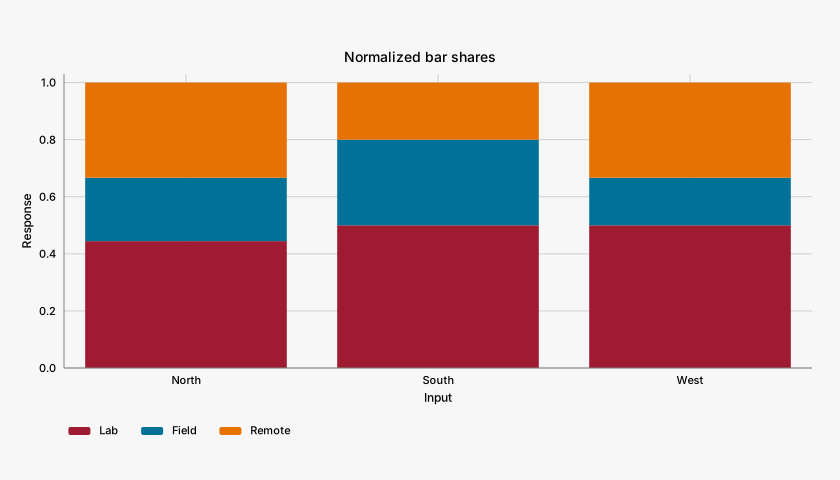
Core marks · CS1

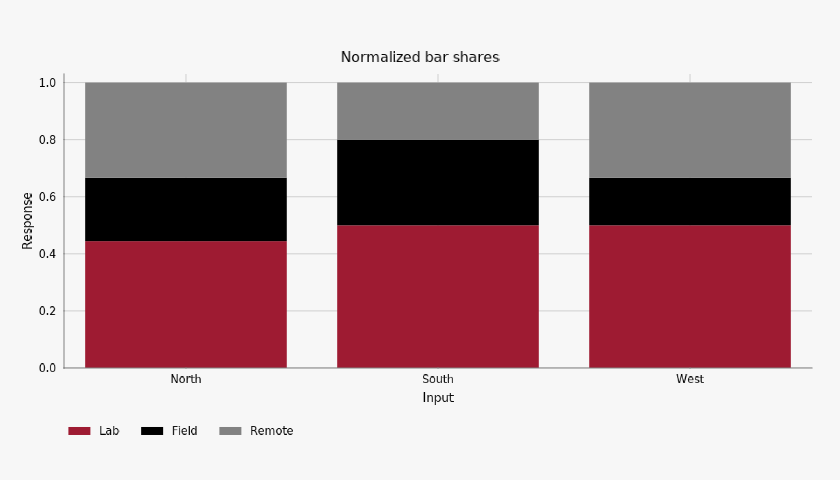
Normalized bar shares

#

Each category's total becomes one whole for share comparisons.

Normalized bar shares, colorset1
Exact palette paintscartesian
Options and implementation

A series-by-category matrix and explicit names keep color alignment stable. mode controls the layout.

xy.barxy.bar_chart

{
  "bar": [
    "series",
    "colors",
    "mode",
    "opacity"
  ]
}
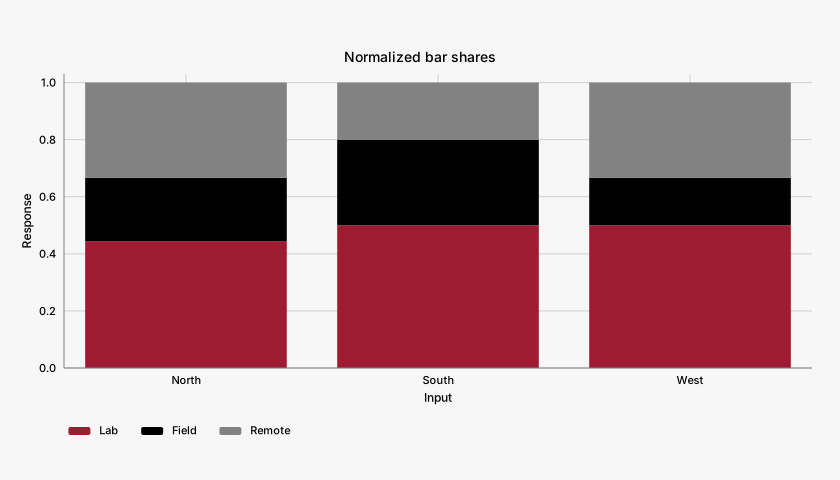
Core marks · CS2

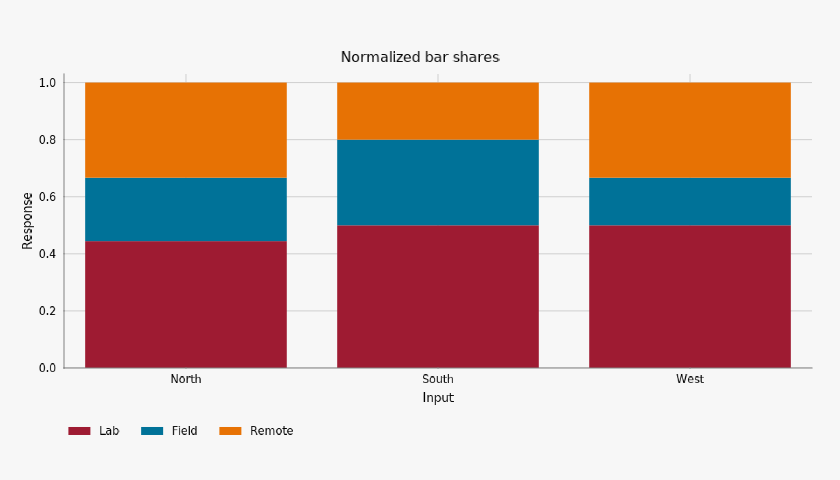
Normalized bar shares

#

Each category's total becomes one whole for share comparisons.

Normalized bar shares, colorset2
Exact palette paintscartesian
Options and implementation

A series-by-category matrix and explicit names keep color alignment stable. mode controls the layout.

xy.barxy.bar_chart

{
  "bar": [
    "series",
    "colors",
    "mode",
    "opacity"
  ]
}
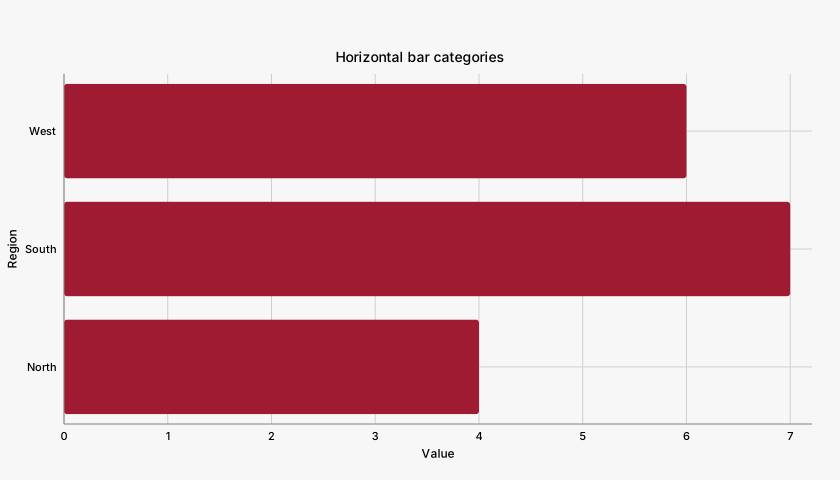
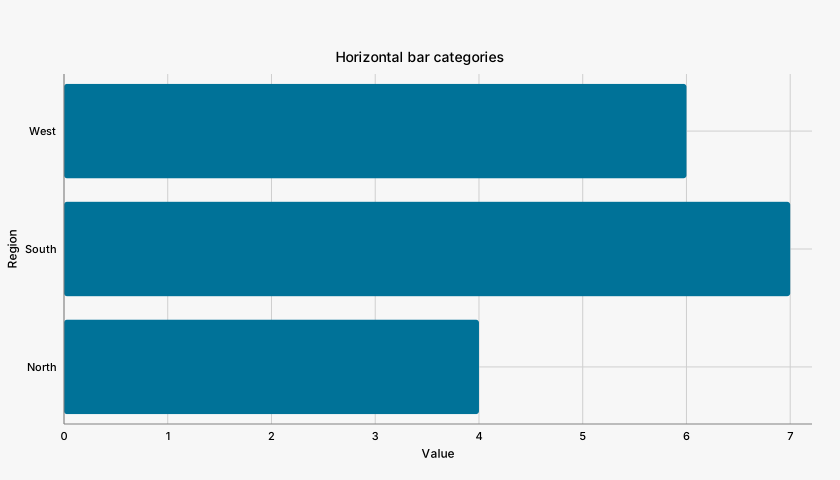
Core marks · CS1

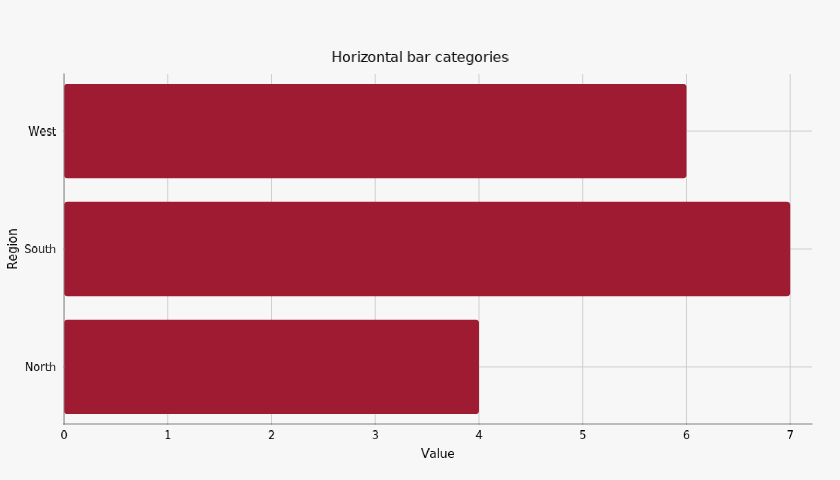
Horizontal bar categories

#

The same bar API places categories on the vertical axis.

Horizontal bar categories, colorset1
Exact palette paintscartesian
Options and implementation

orientation='horizontal' changes the geometry without exchanging source arrays. A named category remains paired with its own value.

xy.barxy.bar_chart

{
  "bar": [
    "orientation",
    "color",
    "opacity",
    "corner_radius"
  ]
}
Core marks · CS2

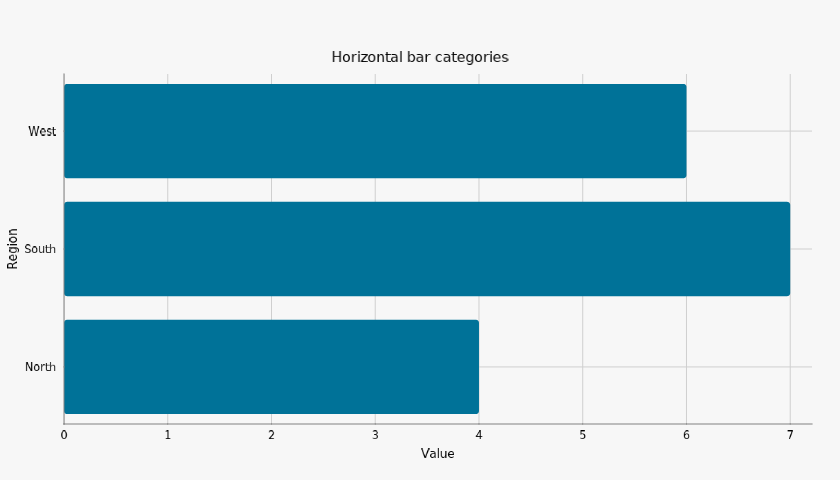
Horizontal bar categories

#

The same bar API places categories on the vertical axis.

Horizontal bar categories, colorset2
Exact palette paintscartesian
Options and implementation

orientation='horizontal' changes the geometry without exchanging source arrays. A named category remains paired with its own value.

xy.barxy.bar_chart

{
  "bar": [
    "orientation",
    "color",
    "opacity",
    "corner_radius"
  ]
}
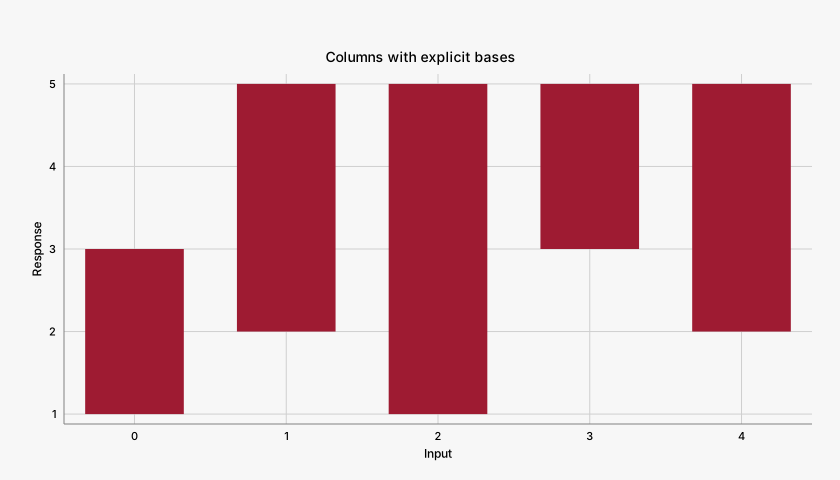
Core marks · CS1

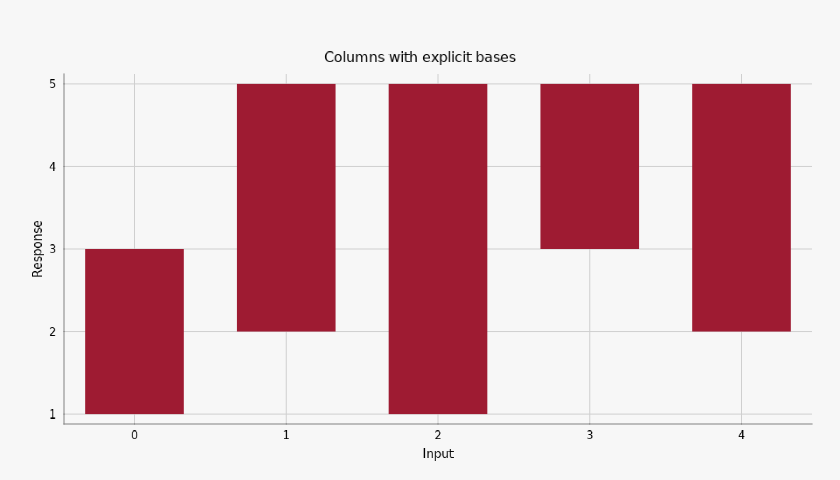
Columns with explicit bases

#

The column alias uses the shared bar renderer and varying baselines.

Columns with explicit bases, colorset1
Exact palette paintscartesian
Options and implementation

y is a height above its matching base; width is in category units, independent of canvas pixels.

xy.columnxy.column_chart

{
  "column": [
    "base",
    "width",
    "color",
    "opacity"
  ]
}
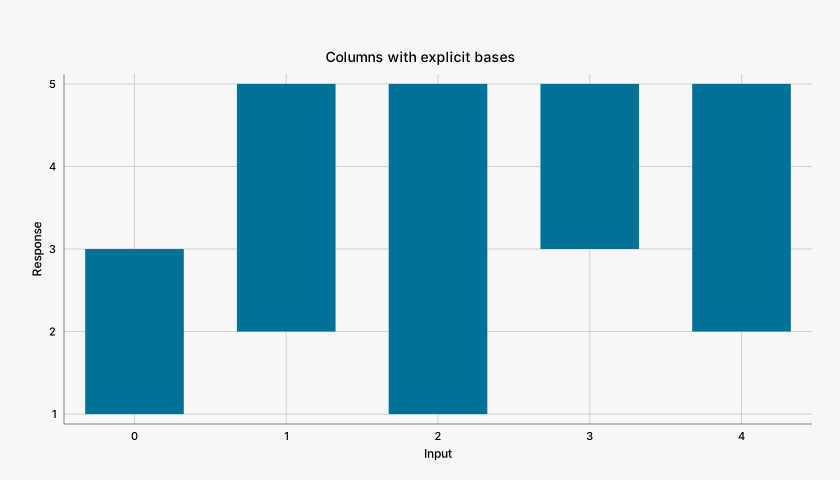
Core marks · CS2

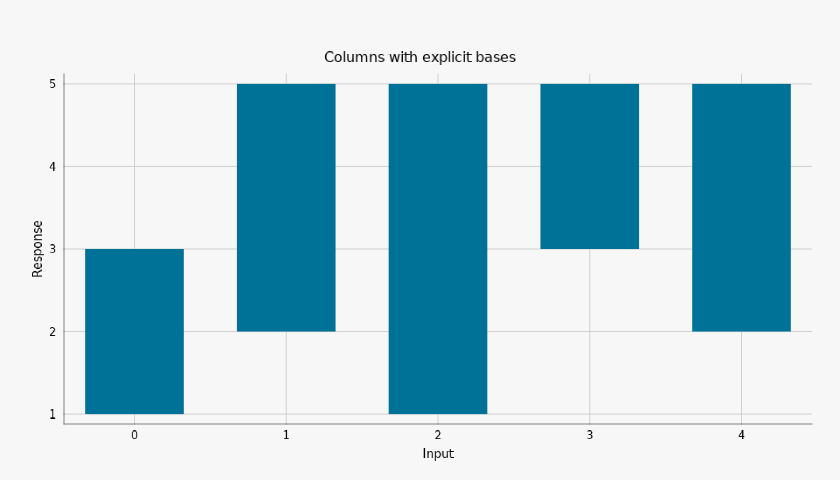
Columns with explicit bases

#

The column alias uses the shared bar renderer and varying baselines.

Columns with explicit bases, colorset2
Exact palette paintscartesian
Options and implementation

y is a height above its matching base; width is in category units, independent of canvas pixels.

xy.columnxy.column_chart

{
  "column": [
    "base",
    "width",
    "color",
    "opacity"
  ]
}
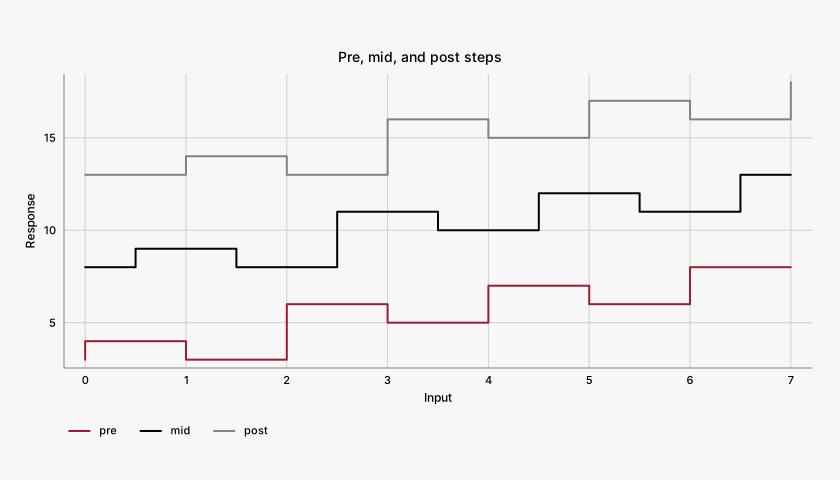
Core marks · CS1

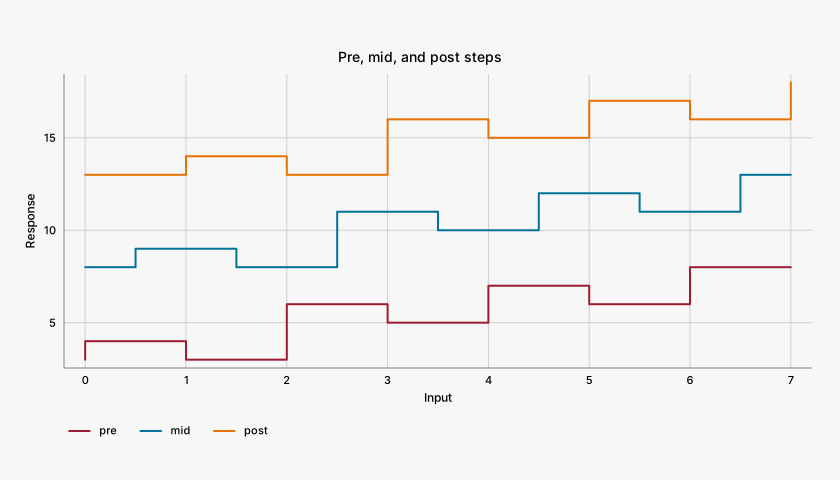
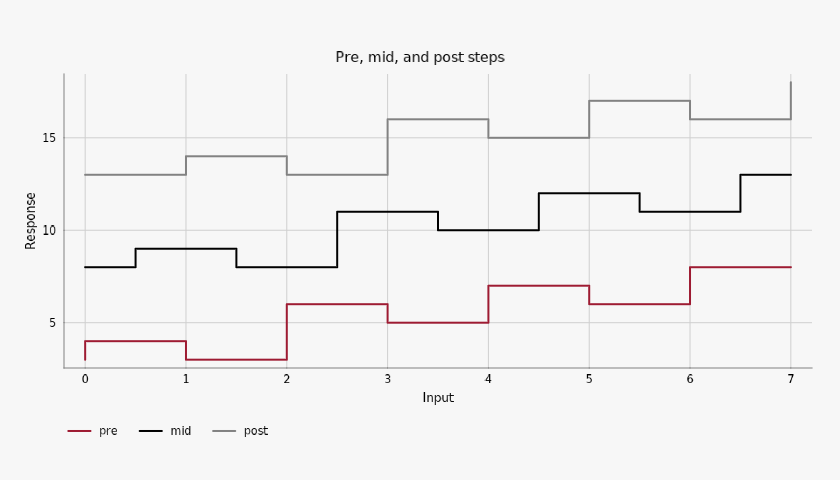
Pre, mid, and post steps

#

Transition convention controls when a sample takes effect.

Pre, mid, and post steps, colorset1
Exact palette paintscartesian
Options and implementation

pre, mid, and post all use the same ordered samples. Lines are vertically offset only to make the conventions readable in one panel.

xy.stepxy.step_chart

{
  "step": [
    "where",
    "color",
    "width",
    "name"
  ]
}
Core marks · CS2

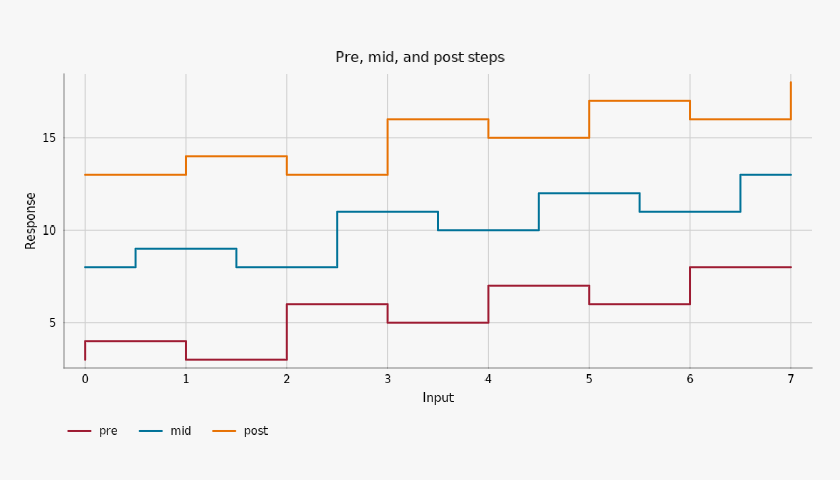
Pre, mid, and post steps

#

Transition convention controls when a sample takes effect.

Pre, mid, and post steps, colorset2
Exact palette paintscartesian
Options and implementation

pre, mid, and post all use the same ordered samples. Lines are vertically offset only to make the conventions readable in one panel.

xy.stepxy.step_chart

{
  "step": [
    "where",
    "color",
    "width",
    "name"
  ]
}
Core marks · CS1

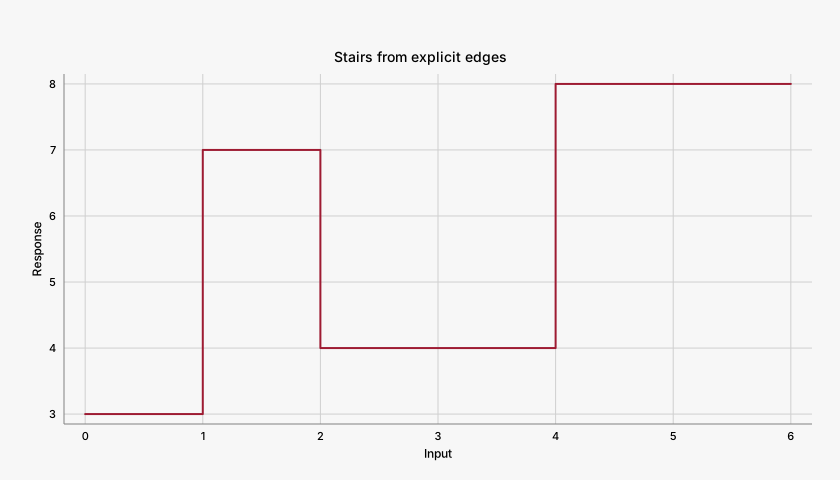
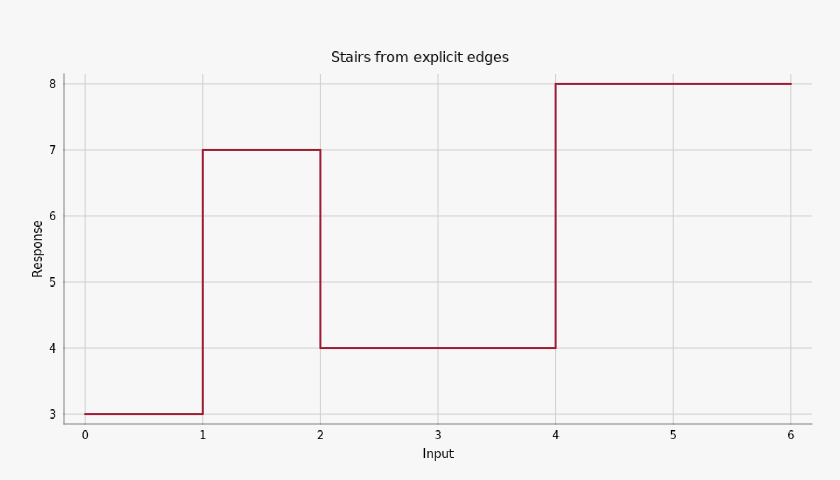
Stairs from explicit edges

#

Four heights describe four unequal-width intervals with five edges.

Stairs from explicit edges, colorset1
Exact palette paintscartesian
Options and implementation

Stairs accepts N heights and N+1 edges, preserving precomputed bin boundaries.

xy.stairsxy.stairs_chart

{
  "stairs": [
    "where",
    "color",
    "width"
  ]
}
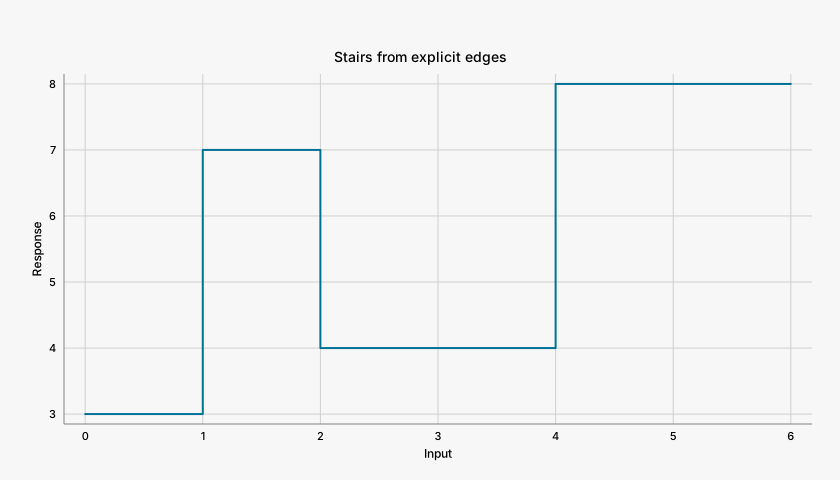
Core marks · CS2

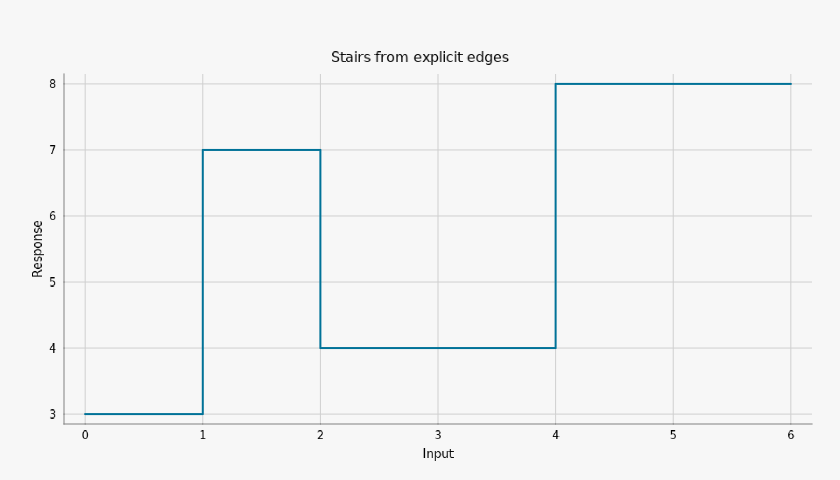
Stairs from explicit edges

#

Four heights describe four unequal-width intervals with five edges.

Stairs from explicit edges, colorset2
Exact palette paintscartesian
Options and implementation

Stairs accepts N heights and N+1 edges, preserving precomputed bin boundaries.

xy.stairsxy.stairs_chart

{
  "stairs": [
    "where",
    "color",
    "width"
  ]
}
Core marks · CS1

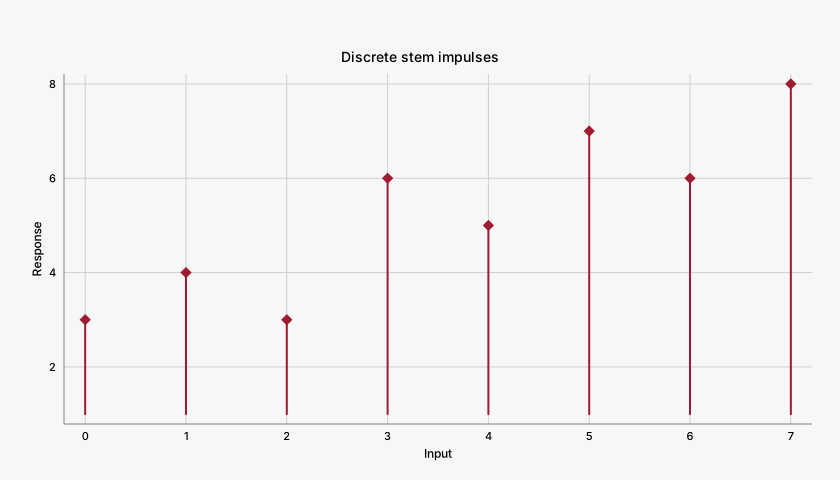
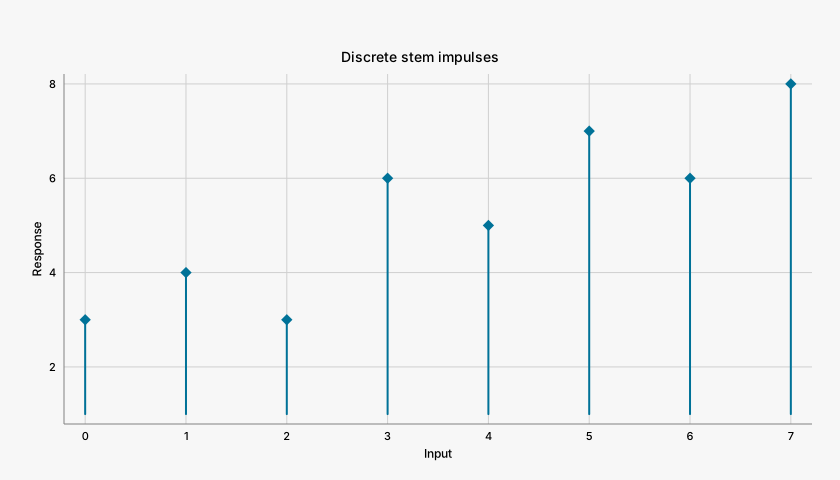
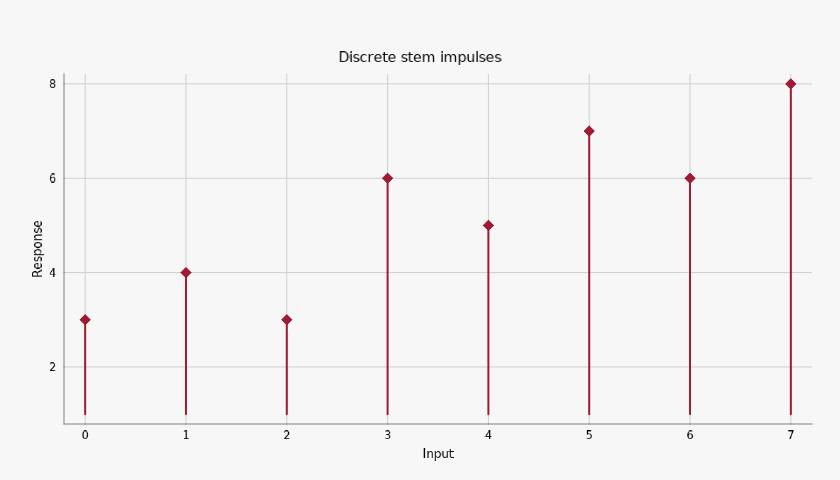
Discrete stem impulses

#

Each sample receives a stem from a baseline and an endpoint marker.

Discrete stem impulses, colorset1
Exact palette paintscartesian
Options and implementation

Marker shape, size, baseline, and stem width vary independently. Input positions stay discrete.

xy.stemxy.stem_chart

{
  "stem": [
    "base",
    "color",
    "width",
    "marker",
    "marker_size",
    "symbol"
  ]
}
Core marks · CS2

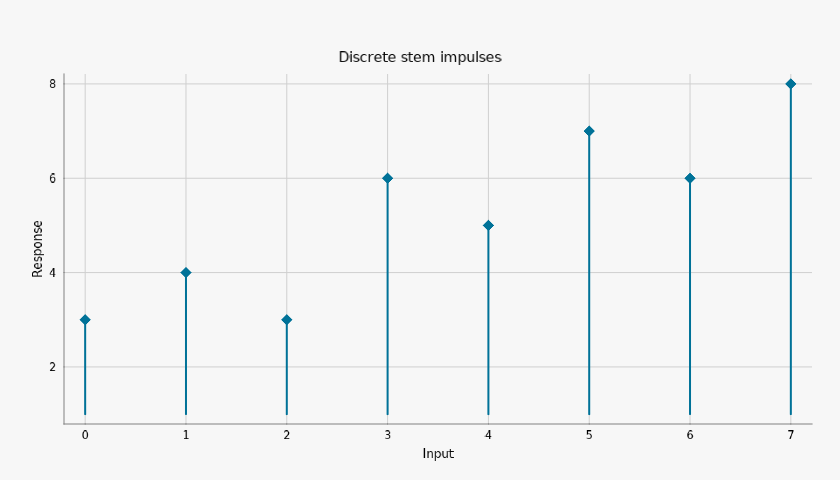
Discrete stem impulses

#

Each sample receives a stem from a baseline and an endpoint marker.

Discrete stem impulses, colorset2
Exact palette paintscartesian
Options and implementation

Marker shape, size, baseline, and stem width vary independently. Input positions stay discrete.

xy.stemxy.stem_chart

{
  "stem": [
    "base",
    "color",
    "width",
    "marker",
    "marker_size",
    "symbol"
  ]
}

Distributions

Distributions · CS1

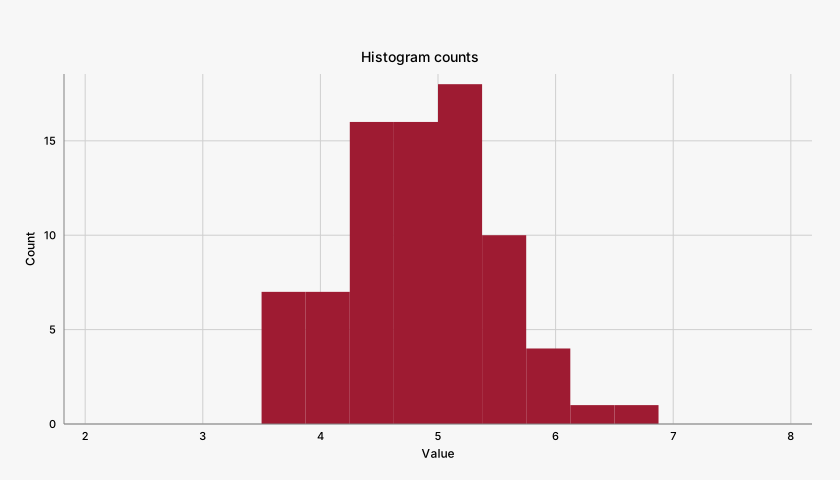
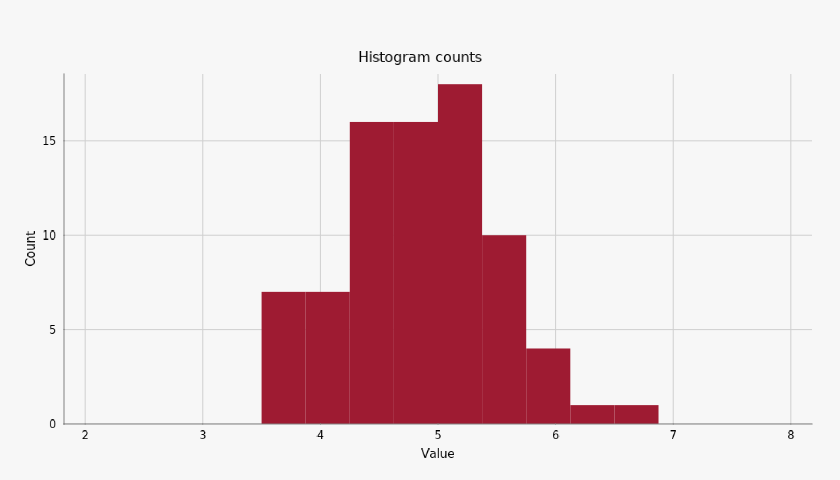
Histogram counts

#

Fixed bin edges preserve the same input sample across representations.

Histogram counts, colorset1
Exact palette paintscartesian
Options and implementation

Count mode shows observations per bin. density=True with cumulative=True shows normalized accumulated mass ending at one when bins cover the sample.

xy.histxy.histogram_chart

{
  "hist": [
    "bins",
    "density",
    "cumulative",
    "color",
    "opacity"
  ]
}
Distributions · CS2

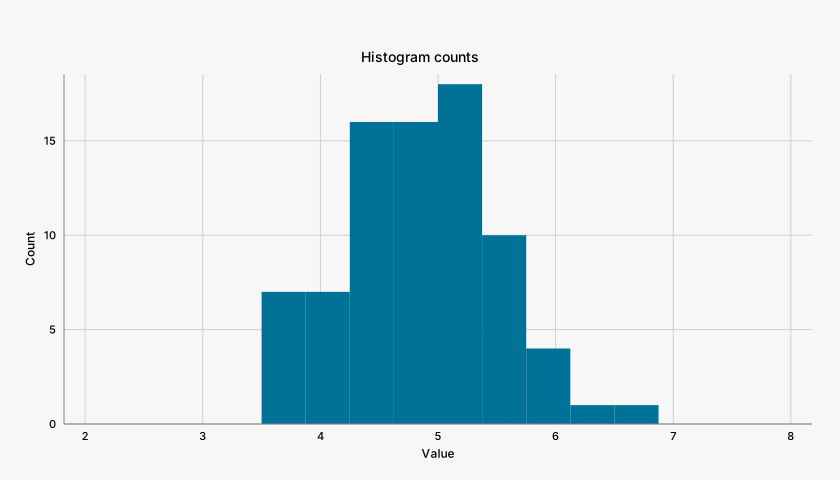
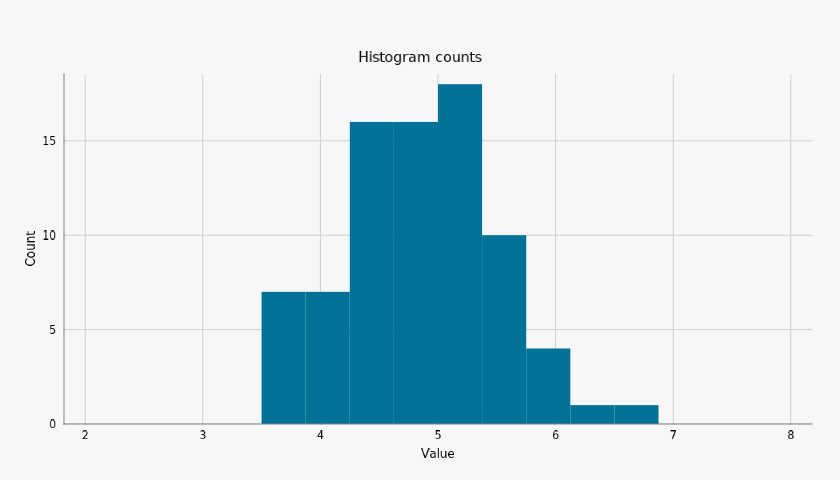
Histogram counts

#

Fixed bin edges preserve the same input sample across representations.

Histogram counts, colorset2
Exact palette paintscartesian
Options and implementation

Count mode shows observations per bin. density=True with cumulative=True shows normalized accumulated mass ending at one when bins cover the sample.

xy.histxy.histogram_chart

{
  "hist": [
    "bins",
    "density",
    "cumulative",
    "color",
    "opacity"
  ]
}
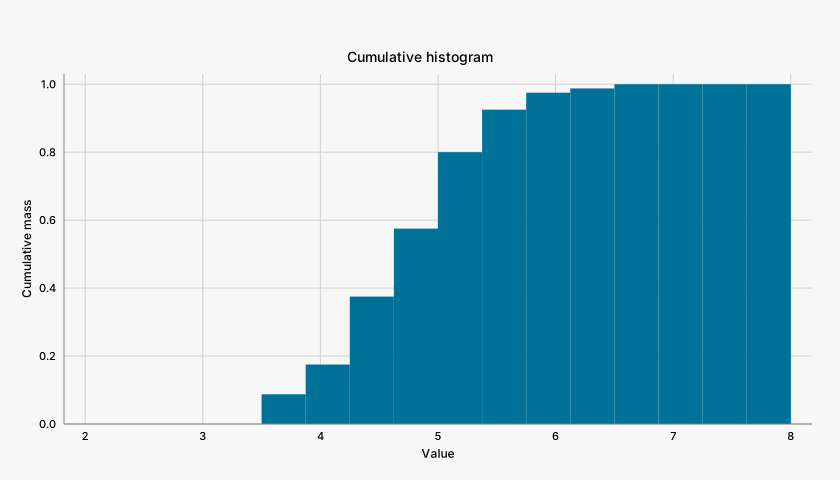
Distributions · CS1

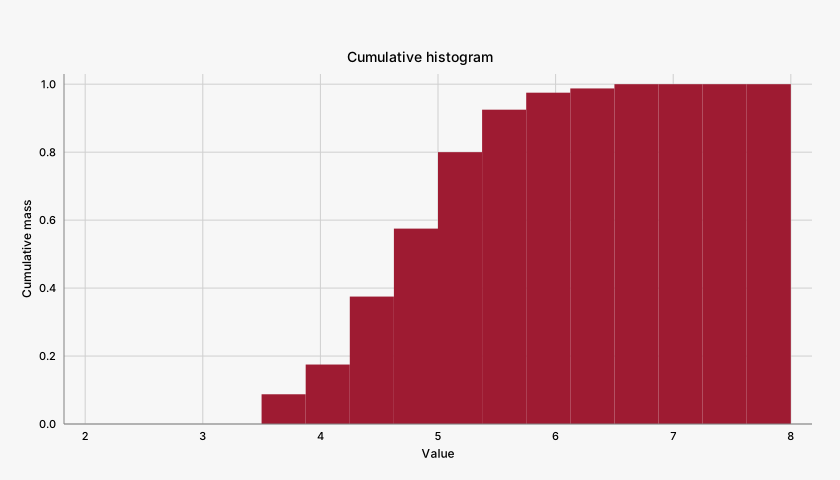
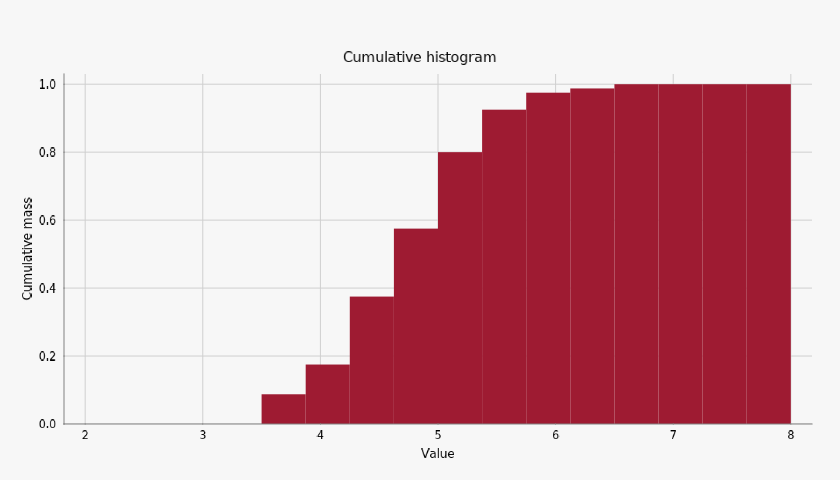
Cumulative histogram

#

Fixed bin edges preserve the same input sample across representations.

Cumulative histogram, colorset1
Exact palette paintscartesian
Options and implementation

Count mode shows observations per bin. density=True with cumulative=True shows normalized accumulated mass ending at one when bins cover the sample.

xy.histogramxy.histogram_chart

{
  "histogram": [
    "bins",
    "density",
    "cumulative",
    "color",
    "opacity"
  ]
}
Distributions · CS2

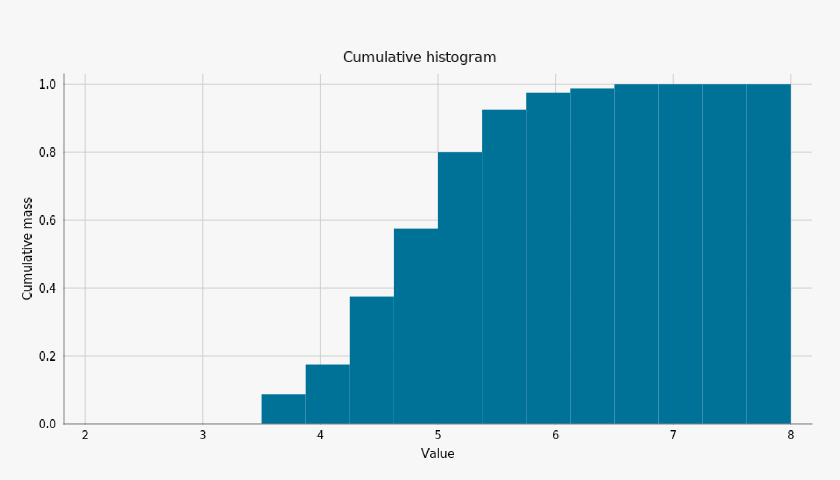
Cumulative histogram

#

Fixed bin edges preserve the same input sample across representations.

Cumulative histogram, colorset2
Exact palette paintscartesian
Options and implementation

Count mode shows observations per bin. density=True with cumulative=True shows normalized accumulated mass ending at one when bins cover the sample.

xy.histogramxy.histogram_chart

{
  "histogram": [
    "bins",
    "density",
    "cumulative",
    "color",
    "opacity"
  ]
}
Distributions · CS1

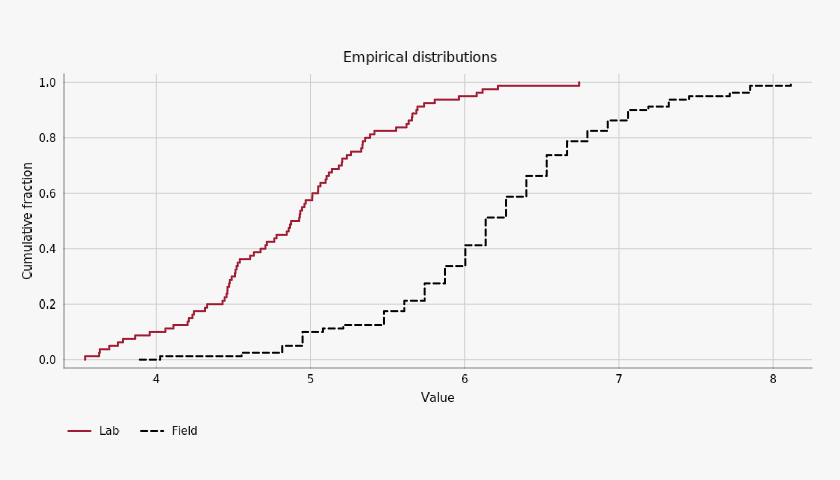
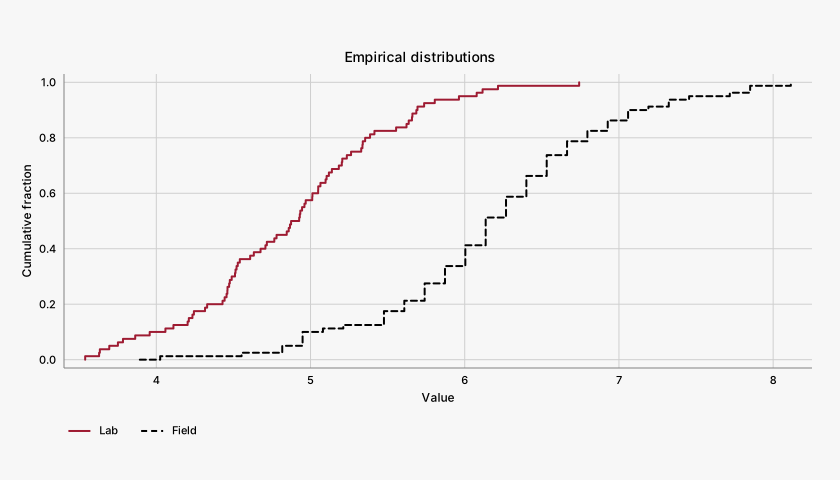
Empirical distributions

#

Two sample distributions become monotone empirical cumulative curves.

Empirical distributions, colorset1
Exact palette paintscartesian
Options and implementation

ECDF sorts sample values internally. bins bounds the evaluation resolution.

xy.ecdfxy.ecdf_chart

{
  "ecdf": [
    "bins",
    "color",
    "width",
    "name",
    "dash"
  ]
}
Distributions · CS2

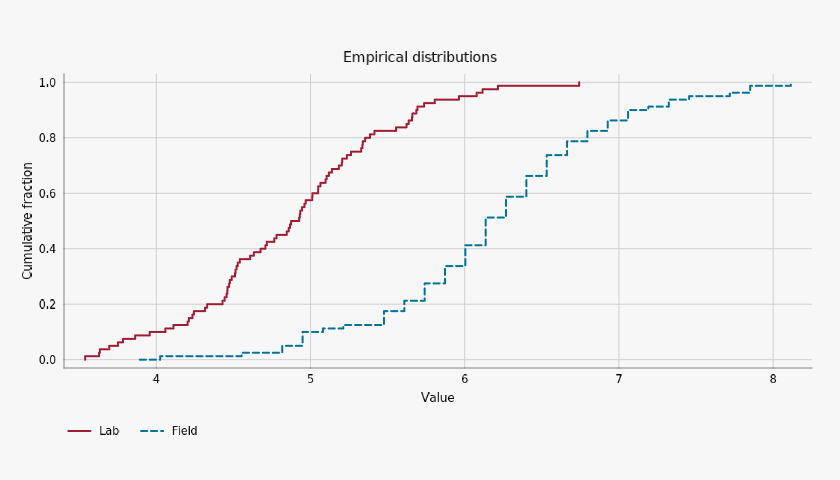
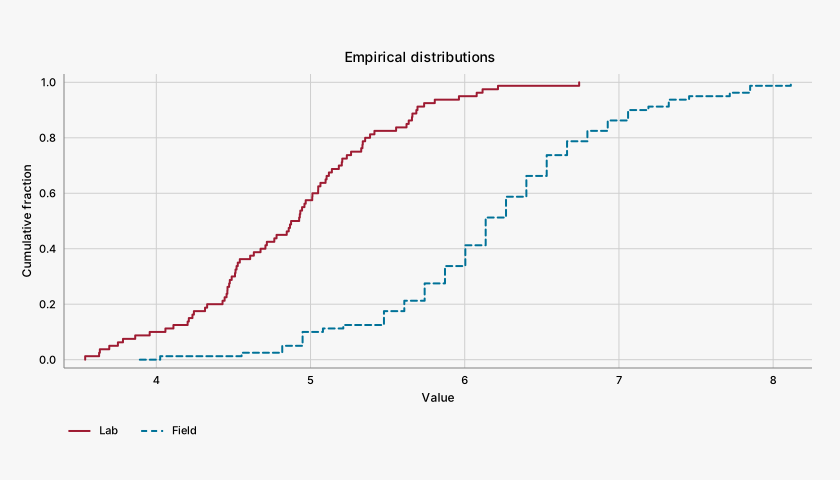
Empirical distributions

#

Two sample distributions become monotone empirical cumulative curves.

Empirical distributions, colorset2
Exact palette paintscartesian
Options and implementation

ECDF sorts sample values internally. bins bounds the evaluation resolution.

xy.ecdfxy.ecdf_chart

{
  "ecdf": [
    "bins",
    "color",
    "width",
    "name",
    "dash"
  ]
}
Distributions · CS1

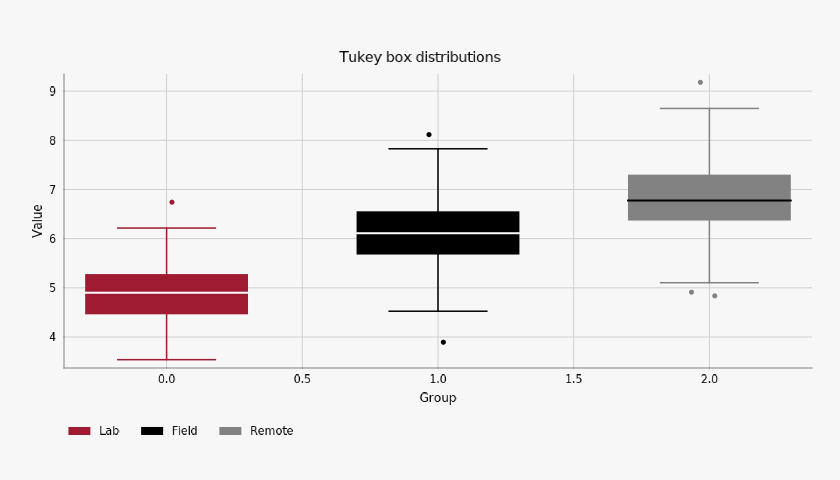
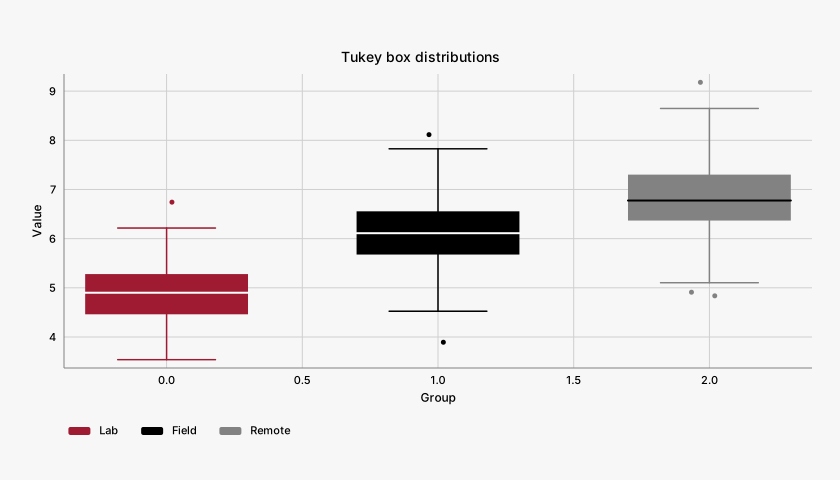
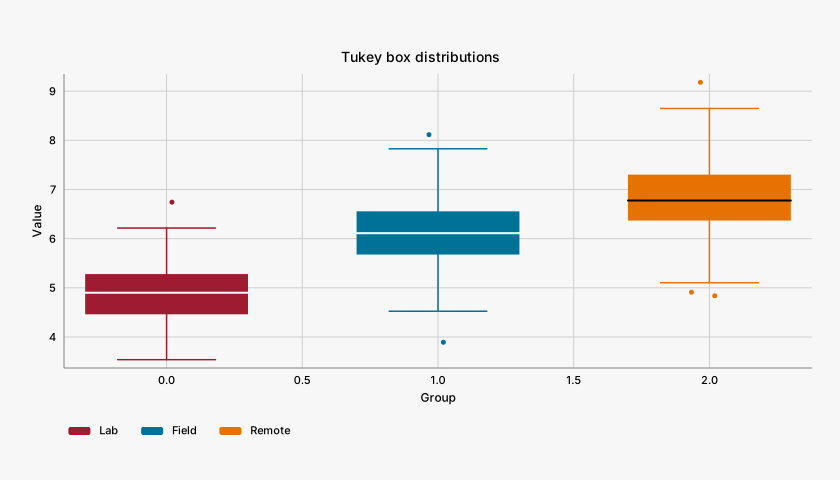
Tukey box distributions

#

Three samples expose quartiles, medians, whiskers, and outliers.

Tukey box distributions, colorset1
Exact palette paintscartesian
Options and implementation

x aligns with sample rows. Whiskers and medians use separate styles; a contrasting median remains visible over an opaque body.

xy.boxxy.box_chart

{
  "box": [
    "x",
    "color",
    "opacity",
    "name",
    "show_outliers",
    "outlier_size",
    "style",
    "median_style",
    "whisker_style"
  ]
}
Distributions · CS2

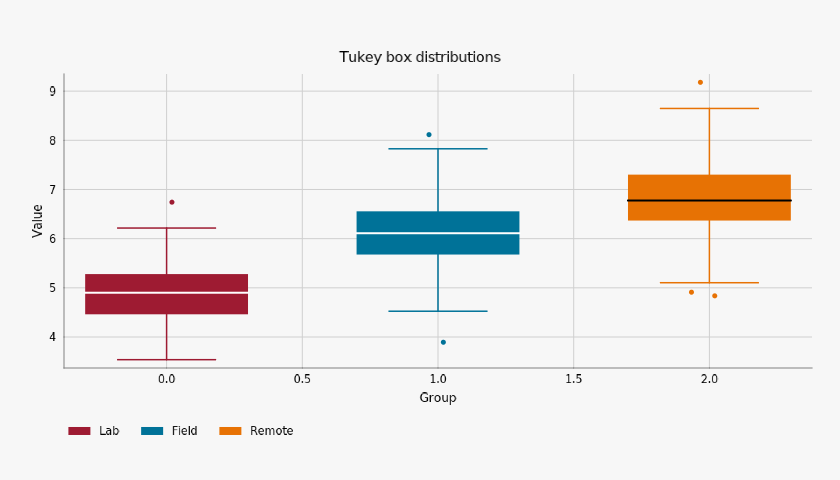
Tukey box distributions

#

Three samples expose quartiles, medians, whiskers, and outliers.

Tukey box distributions, colorset2
Exact palette paintscartesian
Options and implementation

x aligns with sample rows. Whiskers and medians use separate styles; a contrasting median remains visible over an opaque body.

xy.boxxy.box_chart

{
  "box": [
    "x",
    "color",
    "opacity",
    "name",
    "show_outliers",
    "outlier_size",
    "style",
    "median_style",
    "whisker_style"
  ]
}
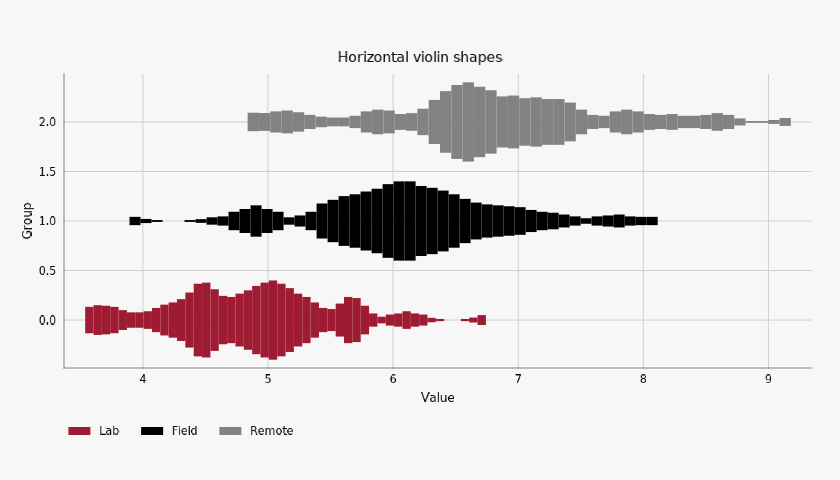
Distributions · CS1

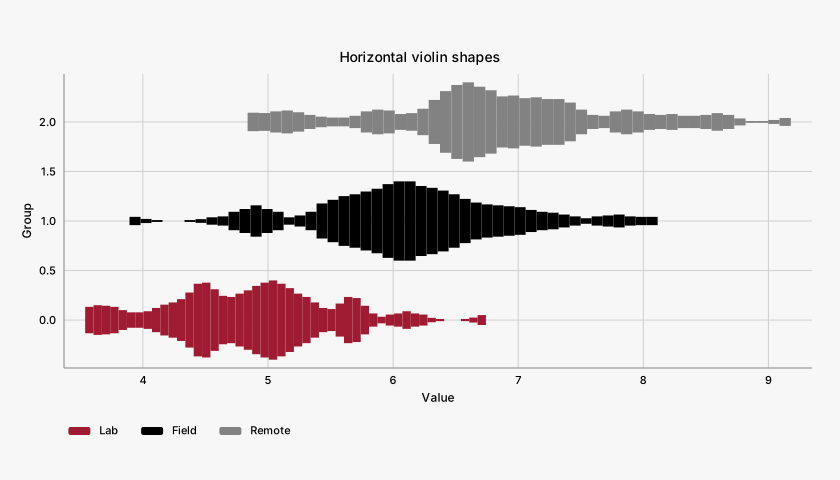
Horizontal violin shapes

#

Bounded-resolution density estimates expose sample distribution shapes.

Horizontal violin shapes, colorset1
Exact palette paintscartesian
Options and implementation

bins sets density resolution. In horizontal orientation, x still holds group positions aligned with sample rows.

xy.violinxy.violin_chart

{
  "violin": [
    "x",
    "color",
    "opacity",
    "name",
    "bins",
    "orientation"
  ]
}
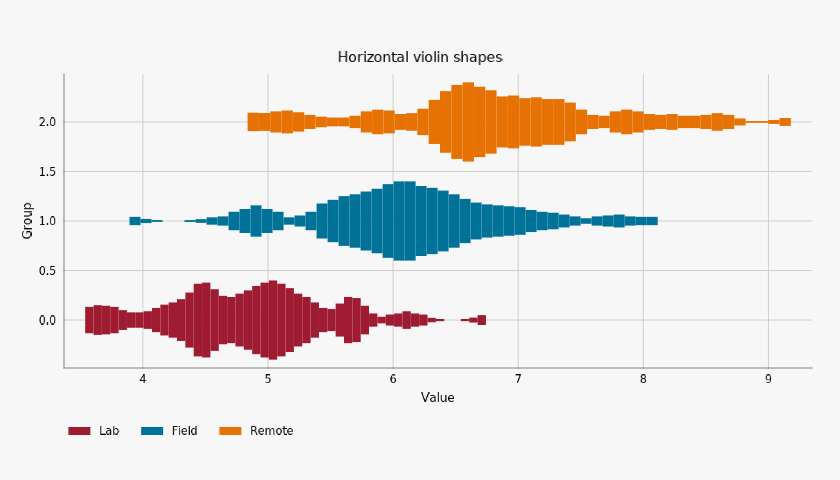
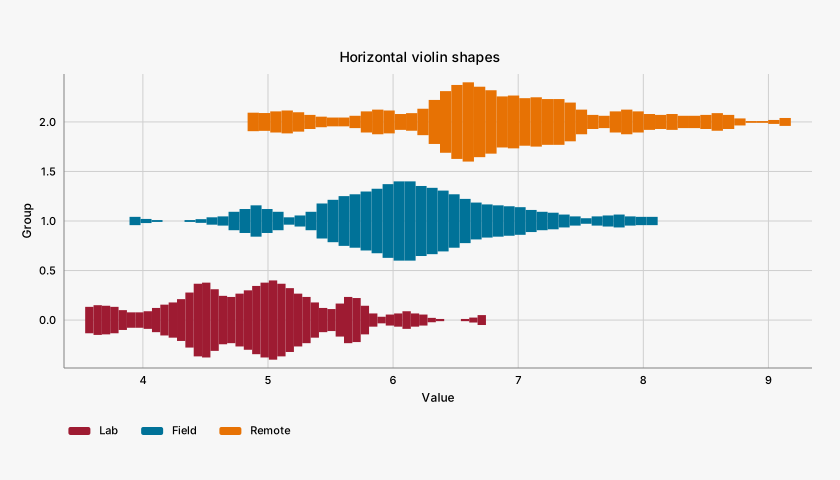
Distributions · CS2

Horizontal violin shapes

#

Bounded-resolution density estimates expose sample distribution shapes.

Horizontal violin shapes, colorset2
Exact palette paintscartesian
Options and implementation

bins sets density resolution. In horizontal orientation, x still holds group positions aligned with sample rows.

xy.violinxy.violin_chart

{
  "violin": [
    "x",
    "color",
    "opacity",
    "name",
    "bins",
    "orientation"
  ]
}
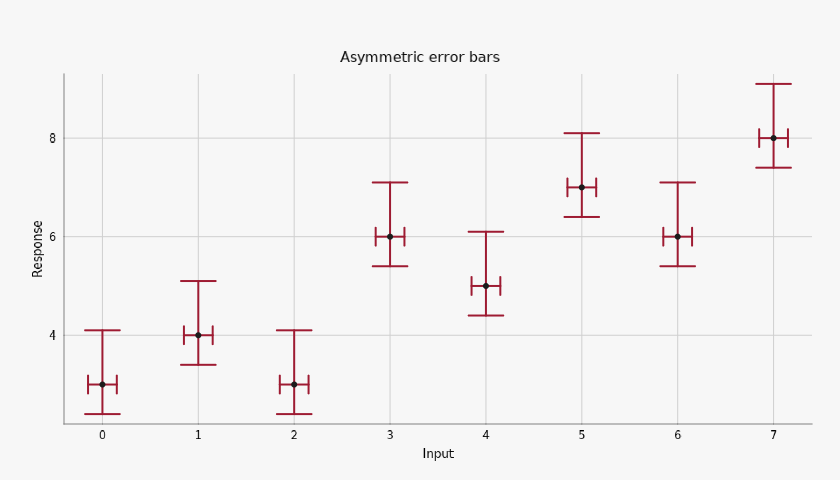
Distributions · CS1

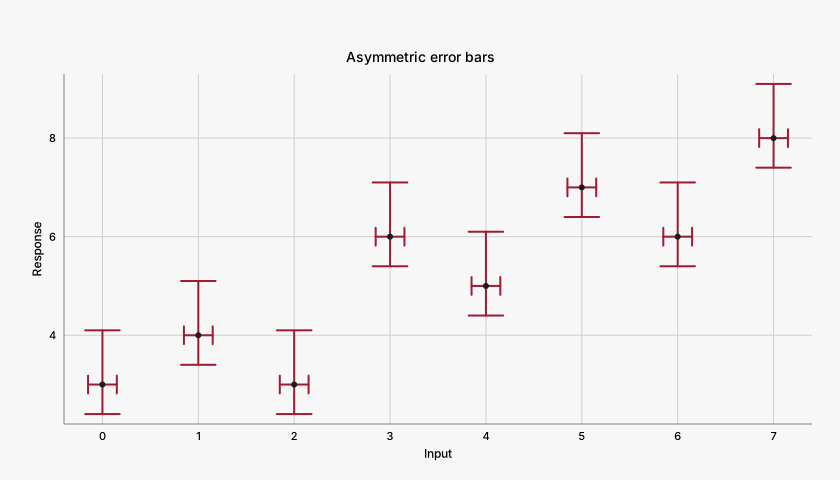
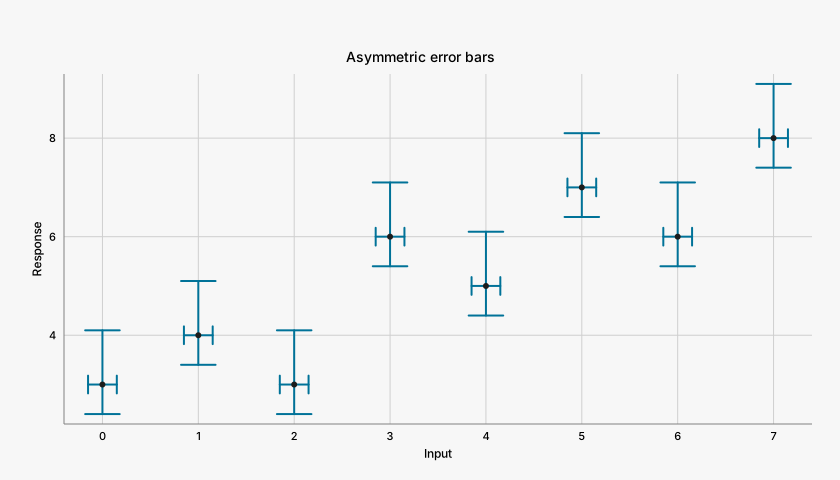
Asymmetric error bars

#

Horizontal and asymmetric vertical uncertainties share the same observations.

Asymmetric error bars, colorset1
Exact palette paintscartesian
Options and implementation

yerr is a lower/upper pair of nonnegative magnitudes. xerr is symmetric. cap_size=.18 uses perpendicular data-axis units, while width is a pixel stroke.

xy.errorbarxy.errorbar_chartxy.scatter

{
  "errorbar": [
    "yerr",
    "xerr",
    "color",
    "width",
    "cap_size"
  ],
  "scatter": [
    "color",
    "size",
    "opacity",
    "density"
  ]
}
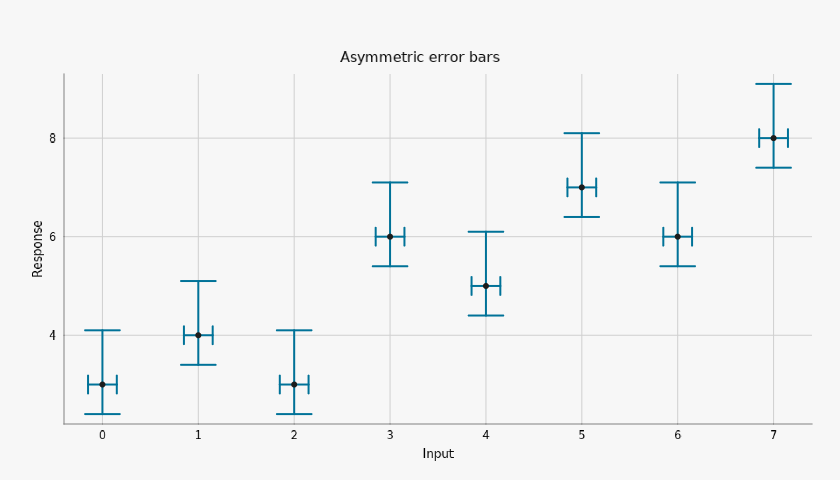
Distributions · CS2

Asymmetric error bars

#

Horizontal and asymmetric vertical uncertainties share the same observations.

Asymmetric error bars, colorset2
Exact palette paintscartesian
Options and implementation

yerr is a lower/upper pair of nonnegative magnitudes. xerr is symmetric. cap_size=.18 uses perpendicular data-axis units, while width is a pixel stroke.

xy.errorbarxy.errorbar_chartxy.scatter

{
  "errorbar": [
    "yerr",
    "xerr",
    "color",
    "width",
    "cap_size"
  ],
  "scatter": [
    "color",
    "size",
    "opacity",
    "density"
  ]
}
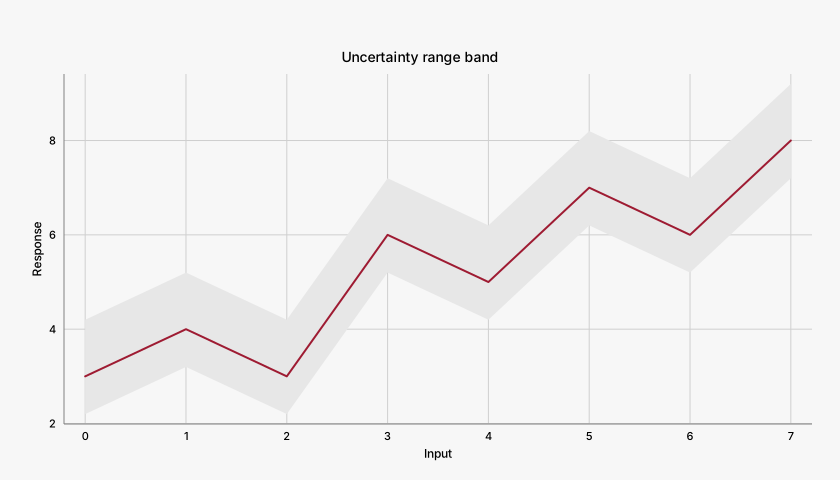
Distributions · CS1

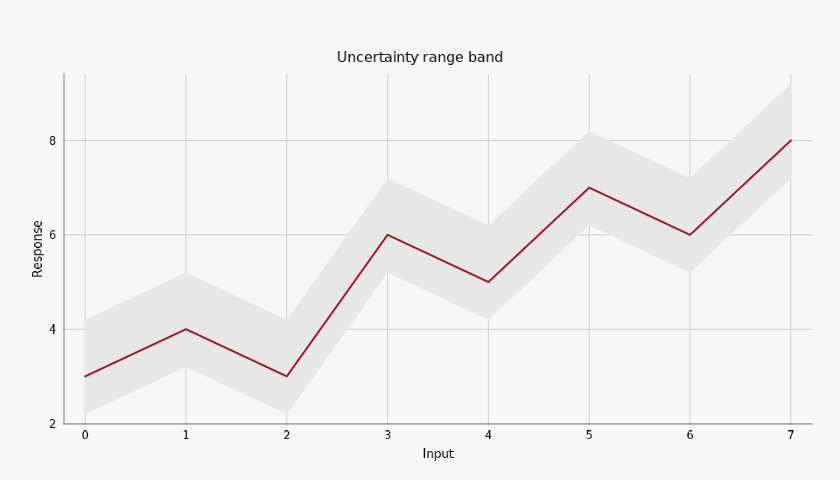
Uncertainty range band

#

Lower and upper arrays bound a central estimate without altering it.

Uncertainty range band, colorset1
Exact palette paintscartesian
Options and implementation

A pale canonical fill distinguishes the interval from its central line. The band does not calculate confidence.

xy.error_bandxy.error_band_chartxy.line

{
  "error_band": [
    "color",
    "opacity",
    "line_width"
  ],
  "line": [
    "color",
    "width"
  ]
}
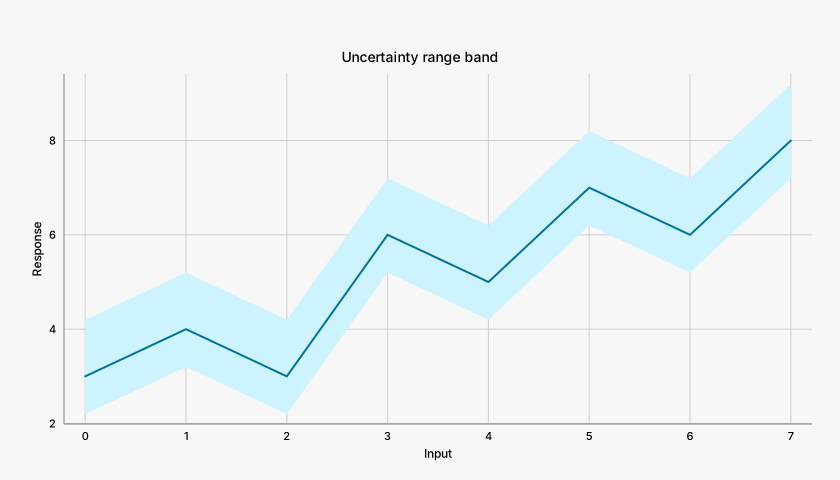
Distributions · CS2

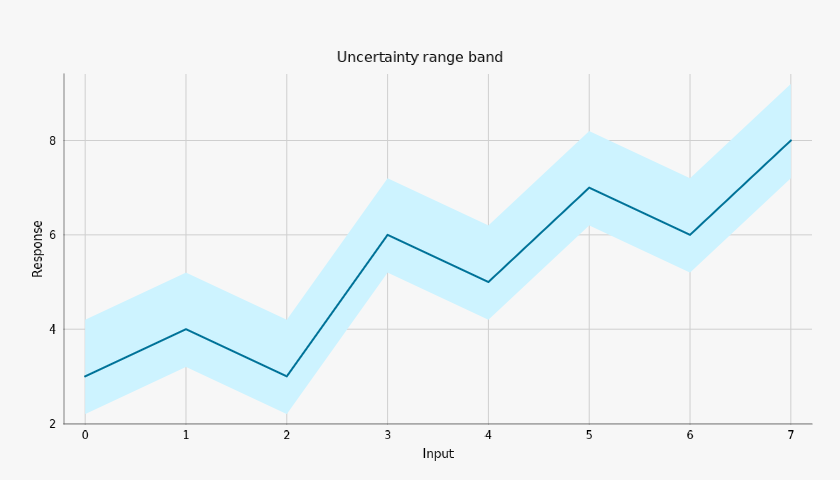
Uncertainty range band

#

Lower and upper arrays bound a central estimate without altering it.

Uncertainty range band, colorset2
Exact palette paintscartesian
Options and implementation

A pale canonical fill distinguishes the interval from its central line. The band does not calculate confidence.

xy.error_bandxy.error_band_chartxy.line

{
  "error_band": [
    "color",
    "opacity",
    "line_width"
  ],
  "line": [
    "color",
    "width"
  ]
}

Fields and flows

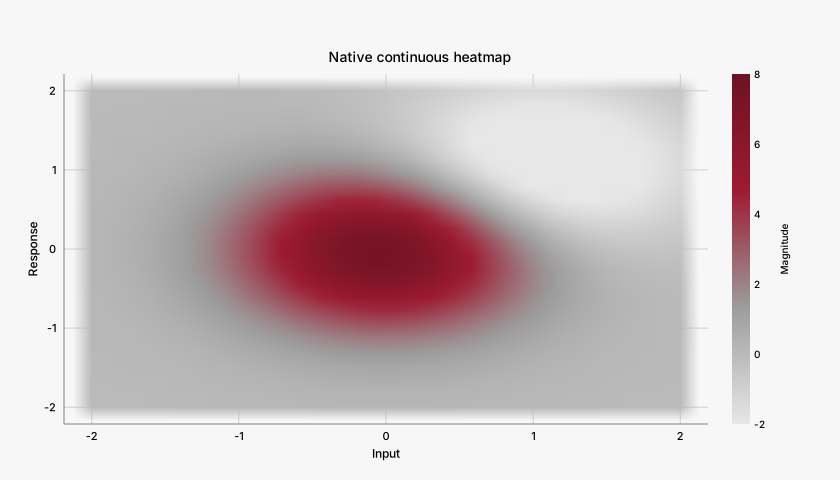
Fields and flows · CS1

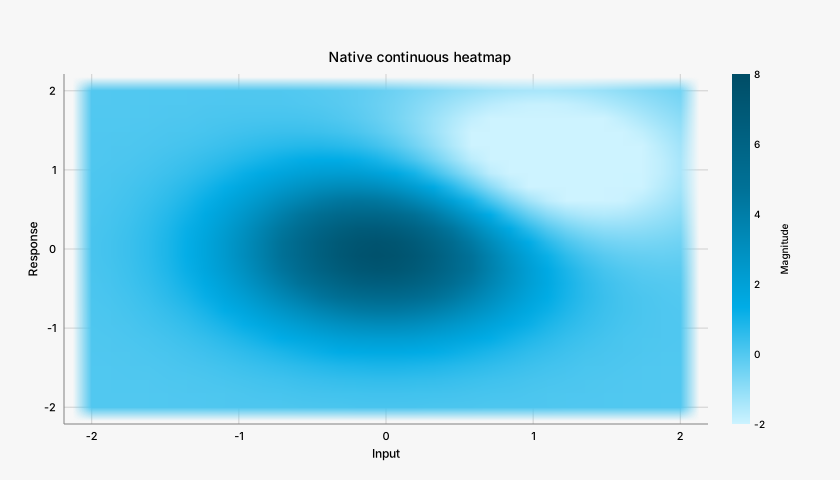
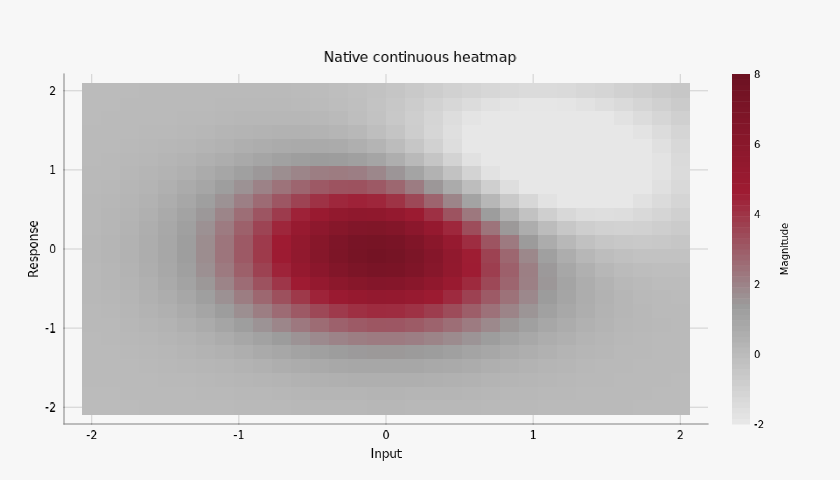
Native continuous heatmap

#

A rectangular numeric grid uses the actual native heatmap mark.

Native continuous heatmap, colorset1
Renderer-derived tonescartesian
Options and implementation

x/y centers align with the matrix dimensions. The native ramp interpolates canonical stops into derived shades; the original gallery separately demonstrates exact bins.

xy.heatmapxy.heatmap_chartxy.colorbar

{
  "heatmap": [
    "x",
    "y",
    "colormap",
    "domain",
    "opacity"
  ],
  "colorbar": [
    "title"
  ]
}
Fields and flows · CS2

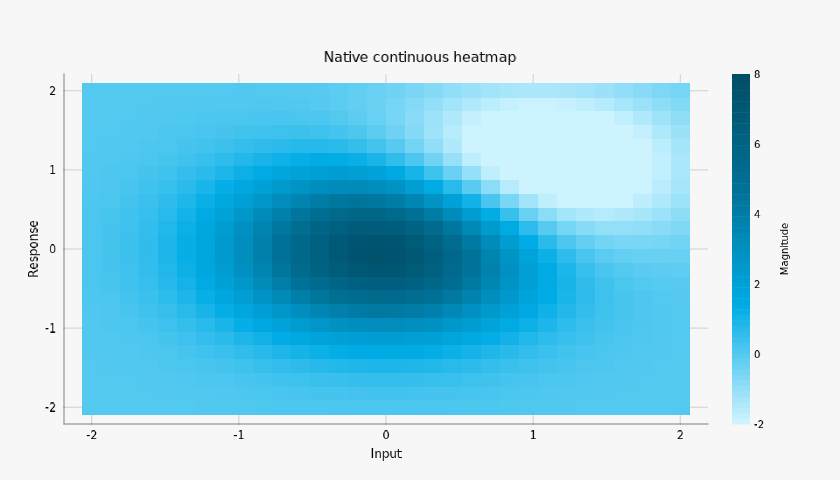
Native continuous heatmap

#

A rectangular numeric grid uses the actual native heatmap mark.

Native continuous heatmap, colorset2
Renderer-derived tonescartesian
Options and implementation

x/y centers align with the matrix dimensions. The native ramp interpolates canonical stops into derived shades; the original gallery separately demonstrates exact bins.

xy.heatmapxy.heatmap_chartxy.colorbar

{
  "heatmap": [
    "x",
    "y",
    "colormap",
    "domain",
    "opacity"
  ],
  "colorbar": [
    "title"
  ]
}
Fields and flows · CS1

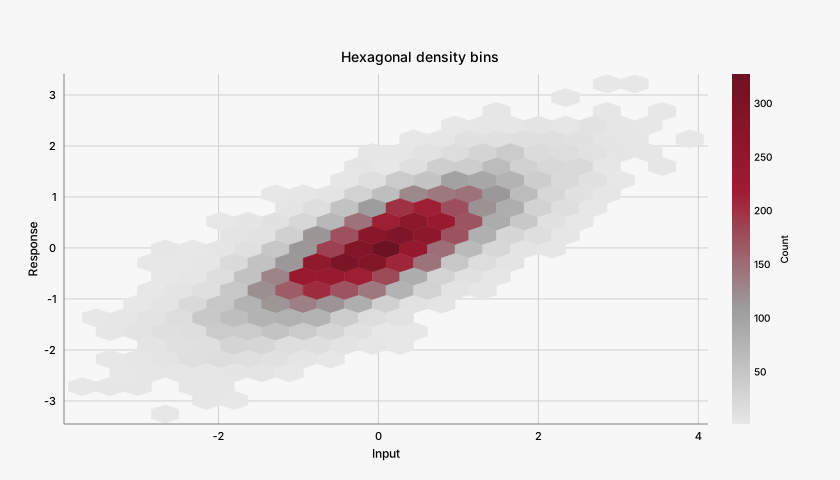
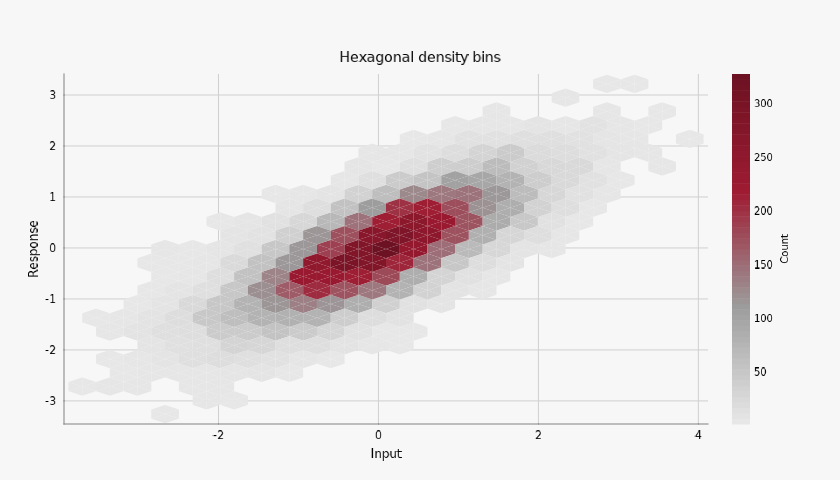
Hexagonal density bins

#

Native hexagonal bins summarize 12,000 points by count.

Hexagonal density bins, colorset1
Renderer-derived tonescartesian
Options and implementation

gridsize controls resolution; mincnt omits empty bins. The count ramp interpolates canonical stops. Each hexagon represents an aggregate.

xy.hexbinxy.hexbin_chartxy.colorbar

{
  "hexbin": [
    "gridsize",
    "bins",
    "mincnt",
    "colormap",
    "opacity"
  ],
  "colorbar": [
    "title"
  ]
}
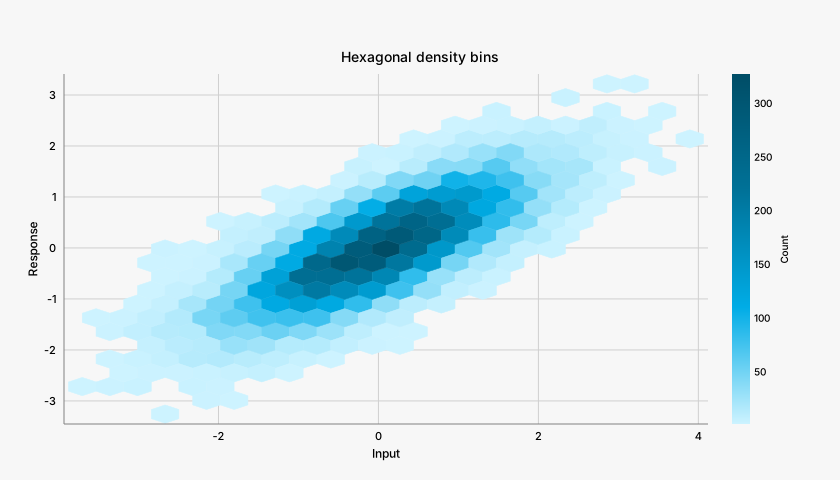
Fields and flows · CS2

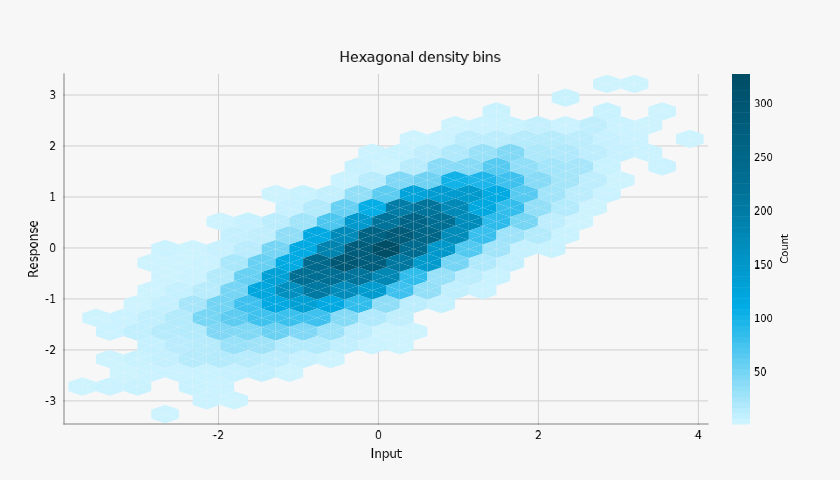
Hexagonal density bins

#

Native hexagonal bins summarize 12,000 points by count.

Hexagonal density bins, colorset2
Renderer-derived tonescartesian
Options and implementation

gridsize controls resolution; mincnt omits empty bins. The count ramp interpolates canonical stops. Each hexagon represents an aggregate.

xy.hexbinxy.hexbin_chartxy.colorbar

{
  "hexbin": [
    "gridsize",
    "bins",
    "mincnt",
    "colormap",
    "opacity"
  ],
  "colorbar": [
    "title"
  ]
}
Fields and flows · CS1

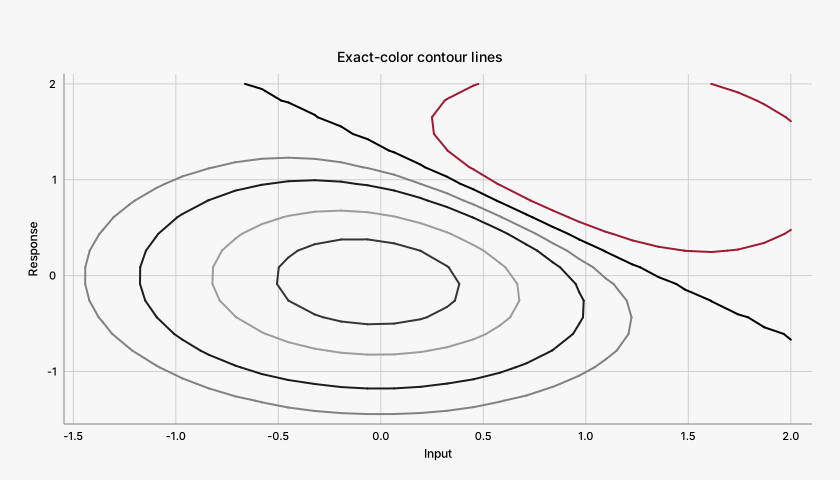
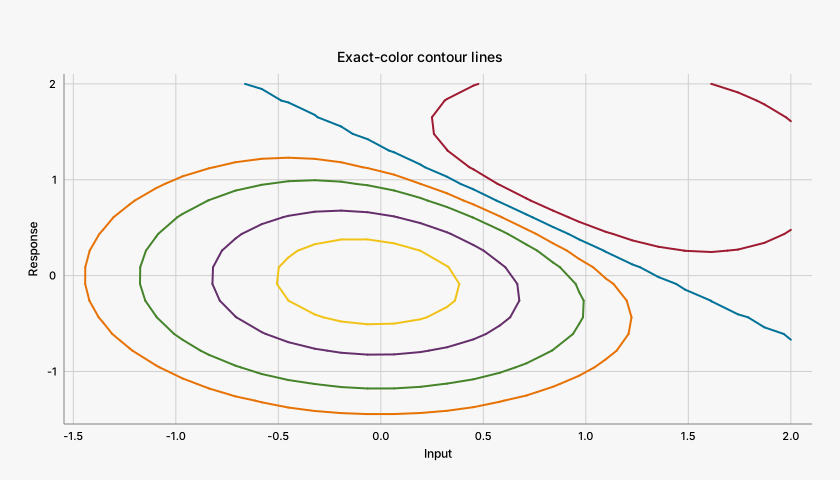
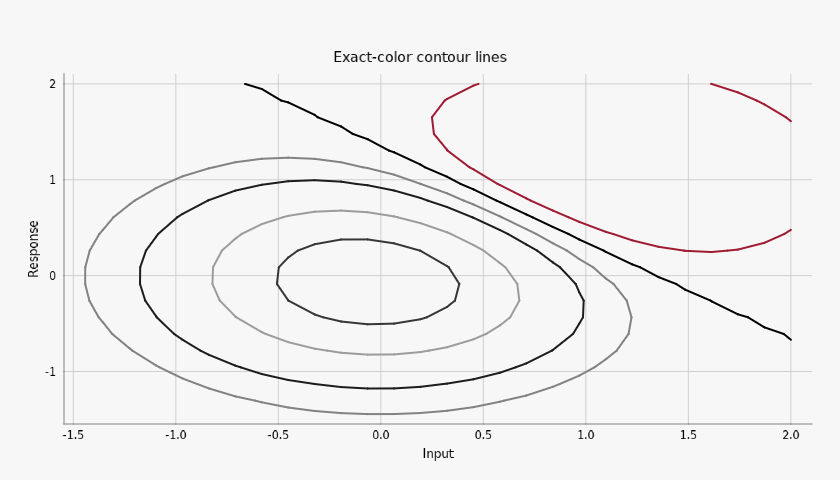
Exact-color contour lines

#

Six isolines trace explicit values of the same regular numeric grid.

Exact-color contour lines, colorset1
Exact palette paintscartesian
Options and implementation

An explicit color list cycles across levels. Negative isolines are dashed for monochrome readability.

xy.contourxy.contour_chart

{
  "contour": [
    "x",
    "y",
    "levels",
    "color",
    "width",
    "opacity",
    "dash_negative"
  ]
}
Fields and flows · CS2

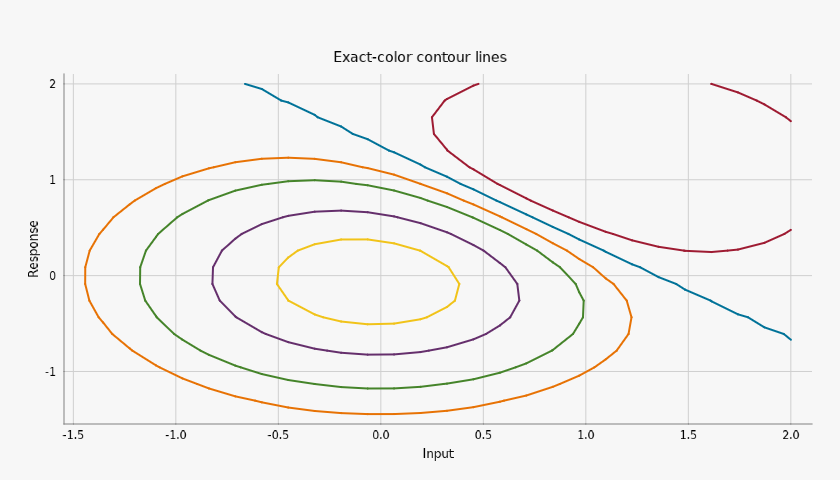
Exact-color contour lines

#

Six isolines trace explicit values of the same regular numeric grid.

Exact-color contour lines, colorset2
Exact palette paintscartesian
Options and implementation

An explicit color list cycles across levels. Negative isolines are dashed for monochrome readability.

xy.contourxy.contour_chart

{
  "contour": [
    "x",
    "y",
    "levels",
    "color",
    "width",
    "opacity",
    "dash_negative"
  ]
}
Fields and flows · CS1

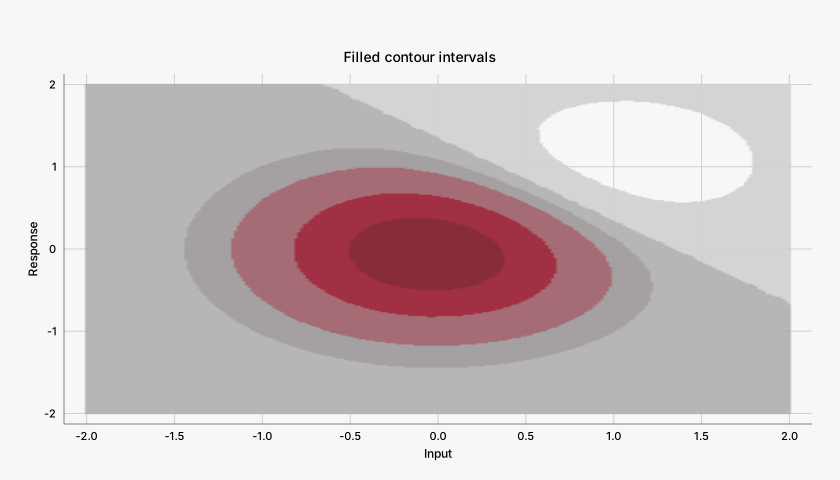
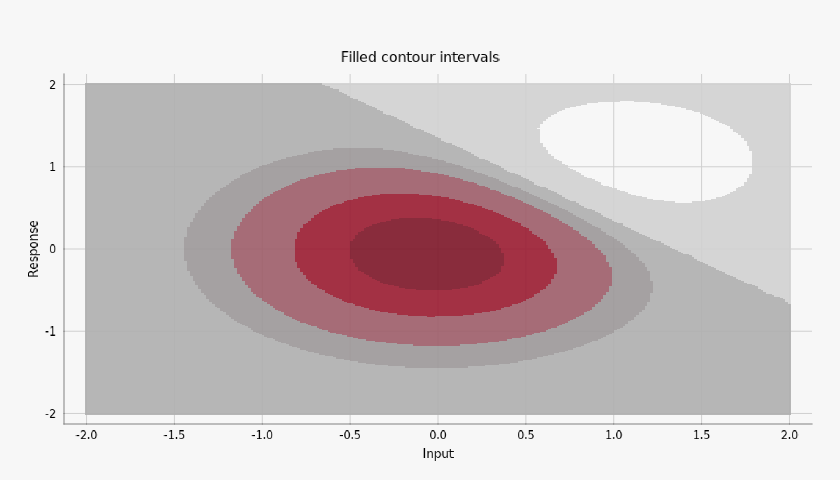
Filled contour intervals

#

Filled intervals reveal the same scalar field between chosen thresholds.

Filled contour intervals, colorset1
Renderer-derived tonescartesian
Options and implementation

filled=True adds interval surfaces with derived ramp shades. corner_mask preserves valid triangles near missing grid corners when a mask is present.

xy.contourxy.contour_chart

{
  "contour": [
    "x",
    "y",
    "levels",
    "filled",
    "colormap",
    "opacity",
    "extend",
    "corner_mask"
  ]
}
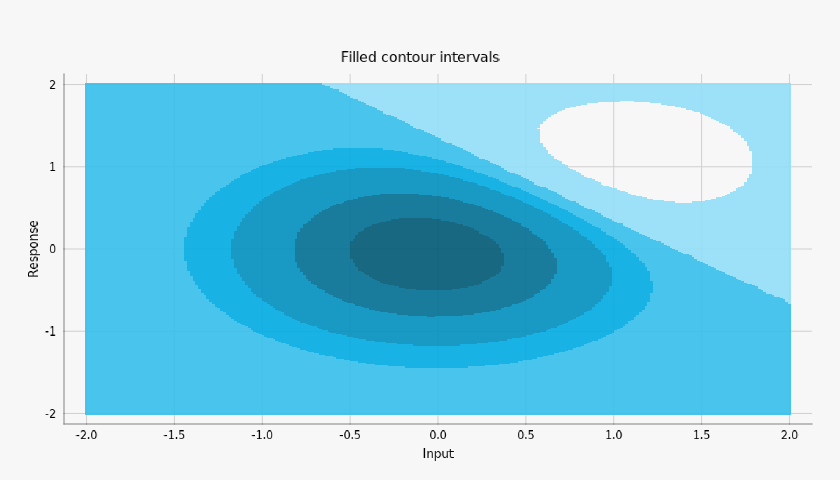
Fields and flows · CS2

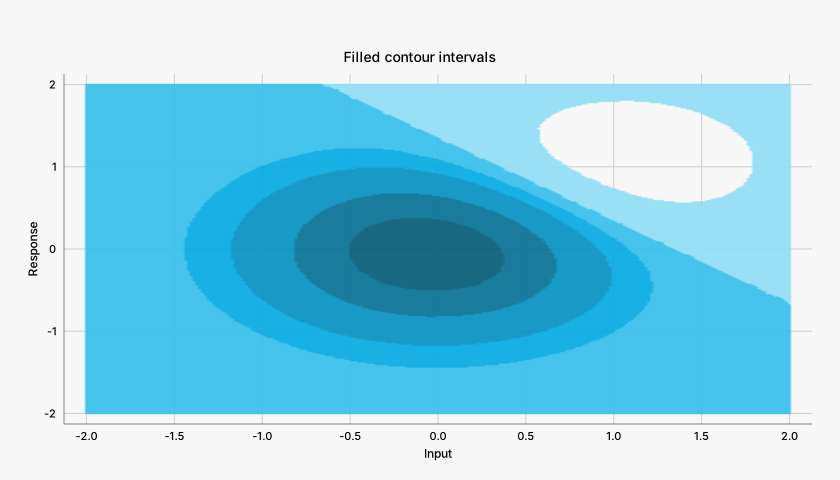
Filled contour intervals

#

Filled intervals reveal the same scalar field between chosen thresholds.

Filled contour intervals, colorset2
Renderer-derived tonescartesian
Options and implementation

filled=True adds interval surfaces with derived ramp shades. corner_mask preserves valid triangles near missing grid corners when a mask is present.

xy.contourxy.contour_chart

{
  "contour": [
    "x",
    "y",
    "levels",
    "filled",
    "colormap",
    "opacity",
    "extend",
    "corner_mask"
  ]
}
Fields and flows · CS1

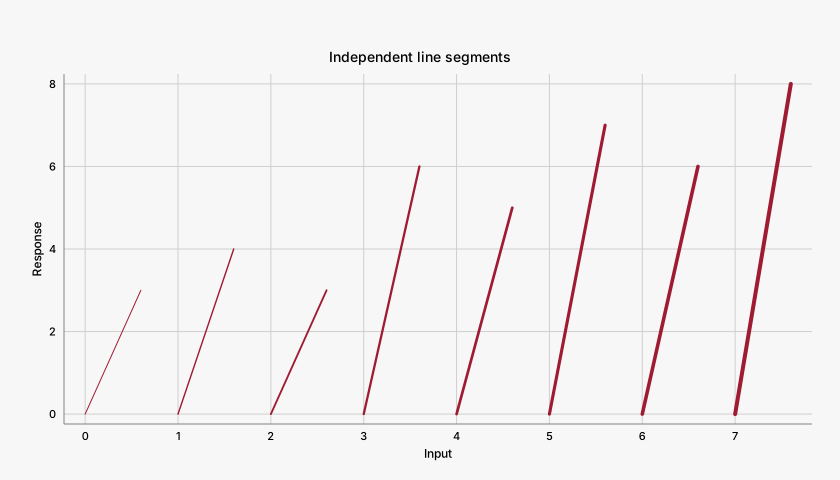
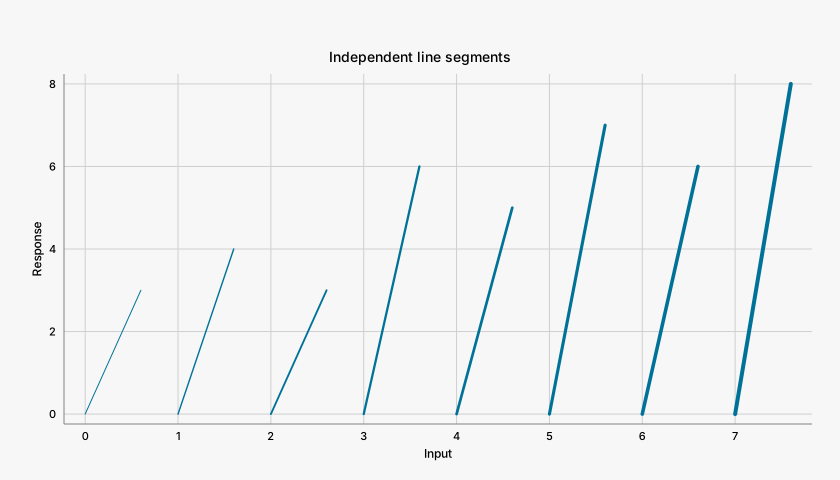
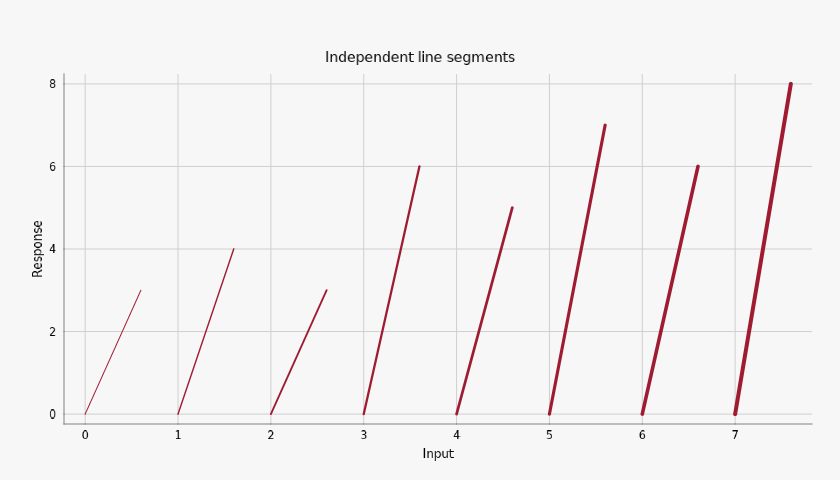
Independent line segments

#

Each row supplies two endpoints and an independent stroke width.

Independent line segments, colorset1
Exact palette paintscartesian
Options and implementation

Segments keep rows independent, useful for intervals, vector fields, whiskers, and structural overlays.

xy.segmentsxy.segments_chart

{
  "segments": [
    "color",
    "width",
    "opacity"
  ]
}
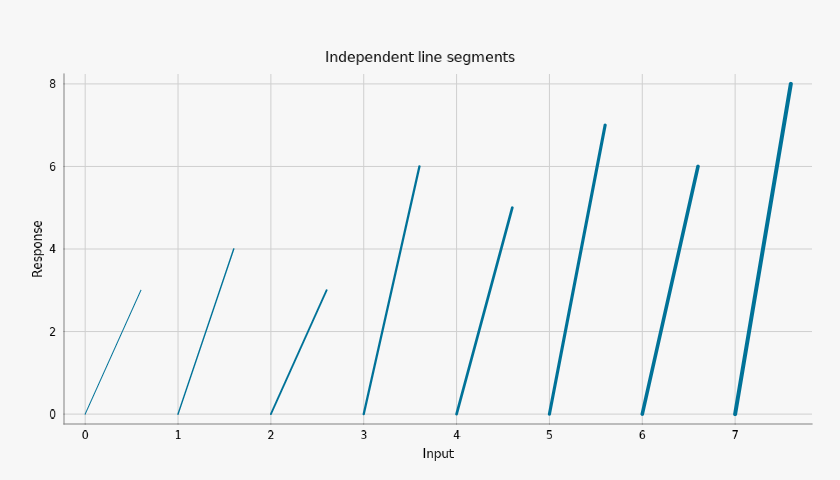
Fields and flows · CS2

Independent line segments

#

Each row supplies two endpoints and an independent stroke width.

Independent line segments, colorset2
Exact palette paintscartesian
Options and implementation

Segments keep rows independent, useful for intervals, vector fields, whiskers, and structural overlays.

xy.segmentsxy.segments_chart

{
  "segments": [
    "color",
    "width",
    "opacity"
  ]
}
Fields and flows · CS1

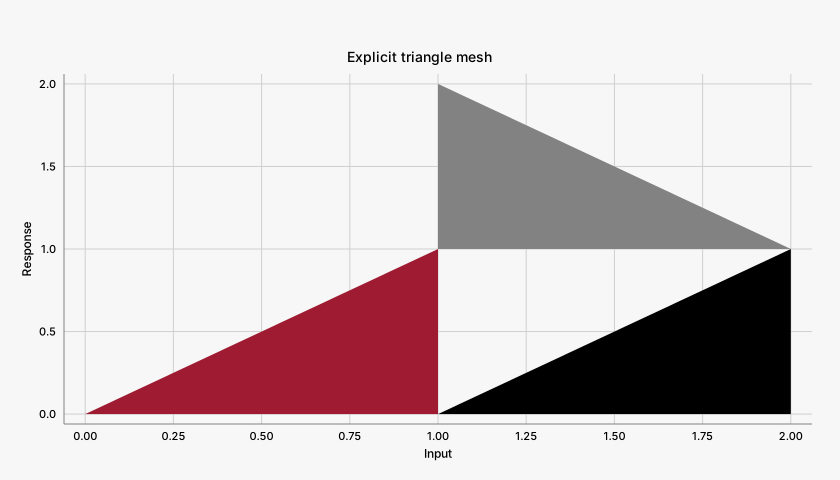
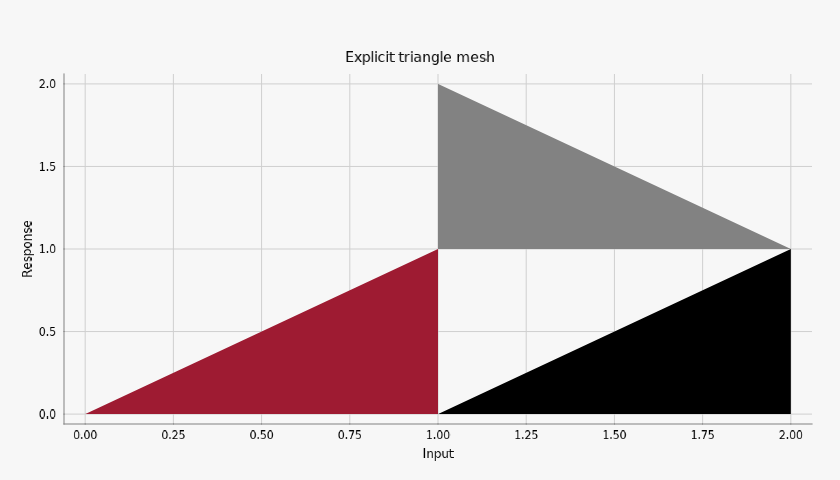
Explicit triangle mesh

#

Three independent triangles carry direct per-triangle palette colors.

Explicit triangle mesh, colorset1
Exact palette paintscartesian
Options and implementation

Each row specifies three vertices. CSS color arrays retain exact paints; numeric colors require a colormap.

xy.triangle_meshxy.triangle_mesh_chart

{
  "triangle_mesh": [
    "color",
    "opacity"
  ]
}
Fields and flows · CS2

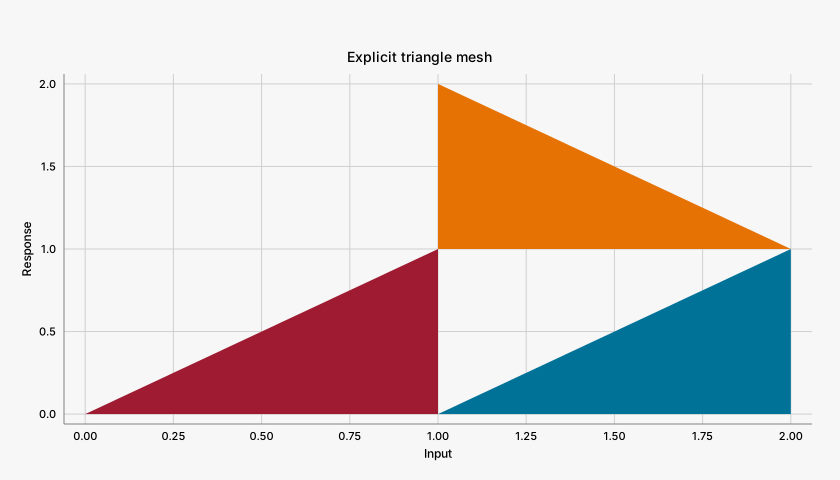
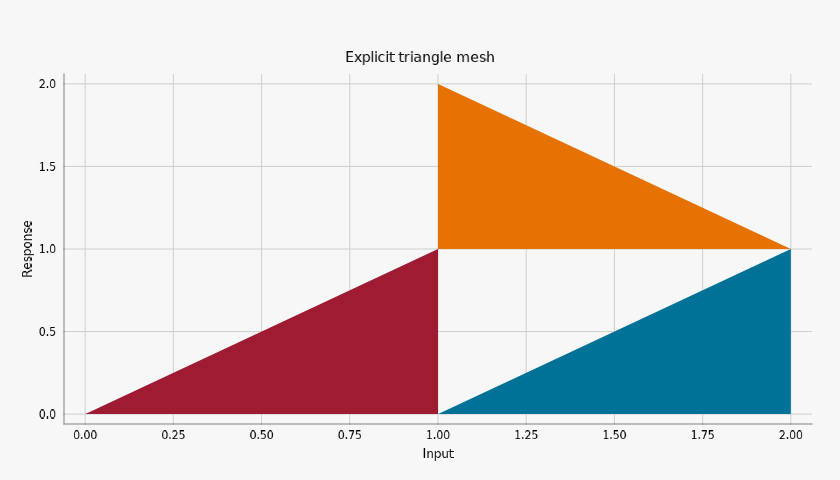
Explicit triangle mesh

#

Three independent triangles carry direct per-triangle palette colors.

Explicit triangle mesh, colorset2
Exact palette paintscartesian
Options and implementation

Each row specifies three vertices. CSS color arrays retain exact paints; numeric colors require a colormap.

xy.triangle_meshxy.triangle_mesh_chart

{
  "triangle_mesh": [
    "color",
    "opacity"
  ]
}
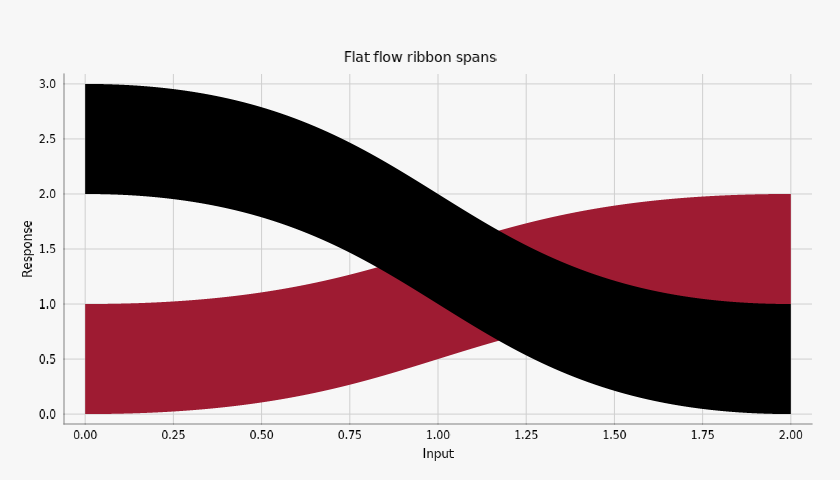
Fields and flows · CS1

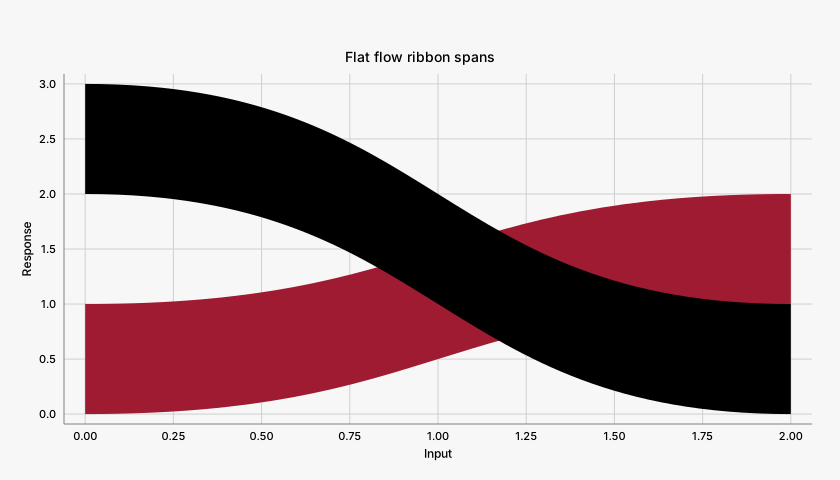
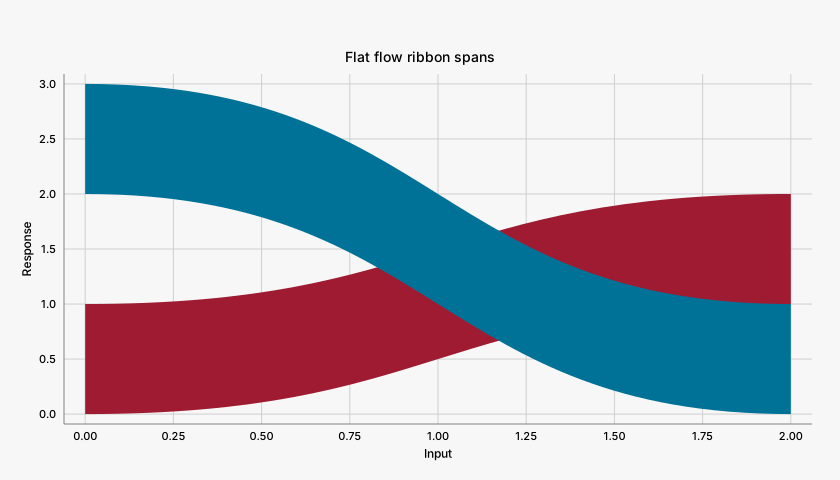
Flat flow ribbon spans

#

Two spans at a source face connect smoothly to two target spans.

Flat flow ribbon spans, colorset1
Exact palette paintscartesian
Options and implementation

Omitting color_target keeps exact flat fills. A different target color produces a gradient along the flow.

xy.ribbonxy.chart

{
  "ribbon": [
    "color",
    "opacity"
  ]
}
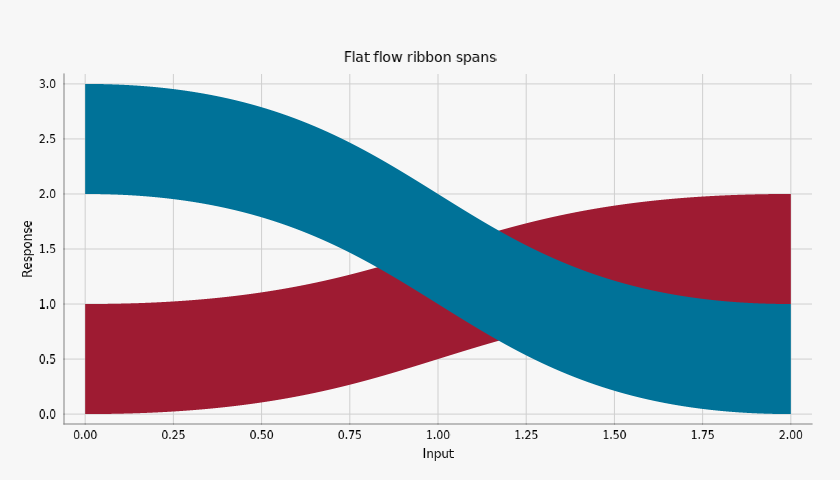
Fields and flows · CS2

Flat flow ribbon spans

#

Two spans at a source face connect smoothly to two target spans.

Flat flow ribbon spans, colorset2
Exact palette paintscartesian
Options and implementation

Omitting color_target keeps exact flat fills. A different target color produces a gradient along the flow.

xy.ribbonxy.chart

{
  "ribbon": [
    "color",
    "opacity"
  ]
}
Fields and flows · CS1

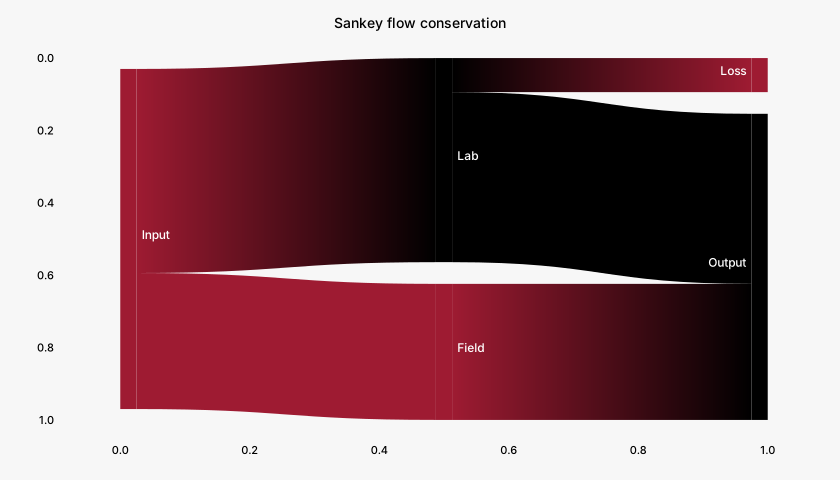
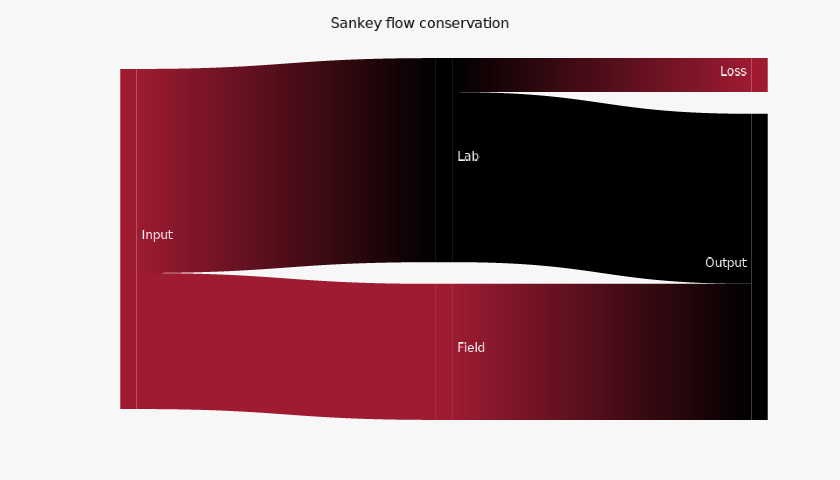
Sankey flow conservation

#

Five weighted links become aligned nodes and proportionate ribbons.

Sankey flow conservation, colorset1
Renderer-derived tonesnone
Options and implementation

Sankey lays out links in Python. Its ribbons interpolate canonical dark node colors into derived gradients. White annotation_text keeps the native labels readable over those dark fills.

xy.sankeyxy.sankey_chartxy.theme

{
  "sankey_chart": [
    "colors",
    "nodes",
    "align",
    "iterations",
    "node_width",
    "node_padding",
    "link_opacity",
    "labels",
    "navigation"
  ],
  "theme": [
    "annotation_text"
  ]
}
Fields and flows · CS2

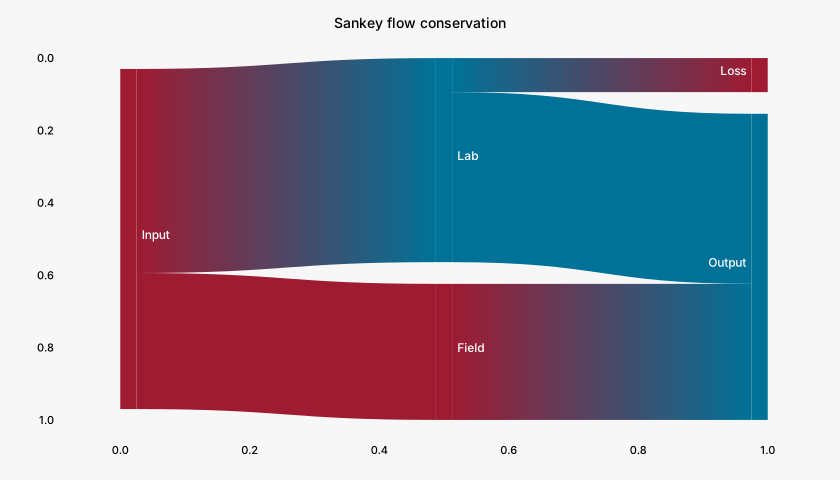
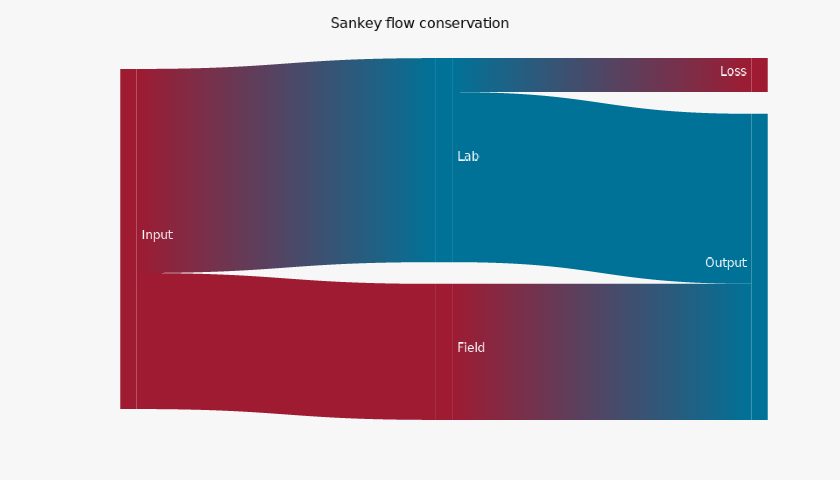
Sankey flow conservation

#

Five weighted links become aligned nodes and proportionate ribbons.

Sankey flow conservation, colorset2
Renderer-derived tonesnone
Options and implementation

Sankey lays out links in Python. Its ribbons interpolate canonical dark node colors into derived gradients. White annotation_text keeps the native labels readable over those dark fills.

xy.sankeyxy.sankey_chartxy.theme

{
  "sankey_chart": [
    "colors",
    "nodes",
    "align",
    "iterations",
    "node_width",
    "node_padding",
    "link_opacity",
    "labels",
    "navigation"
  ],
  "theme": [
    "annotation_text"
  ]
}
Fields and flows · CS1

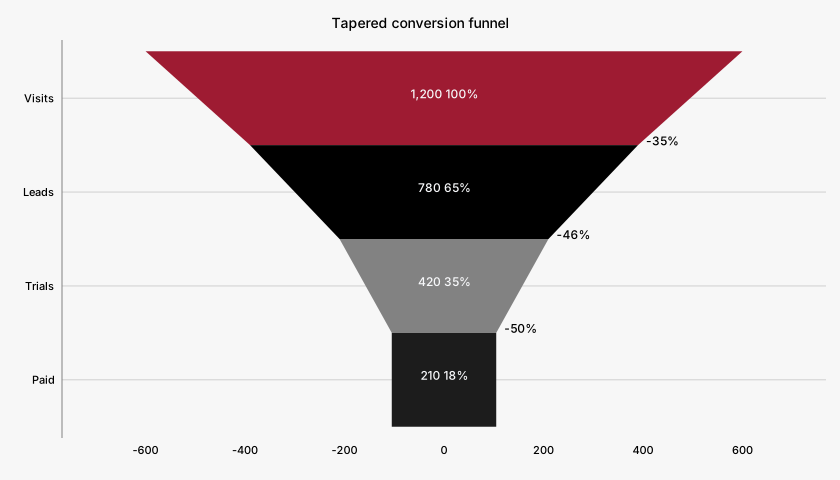
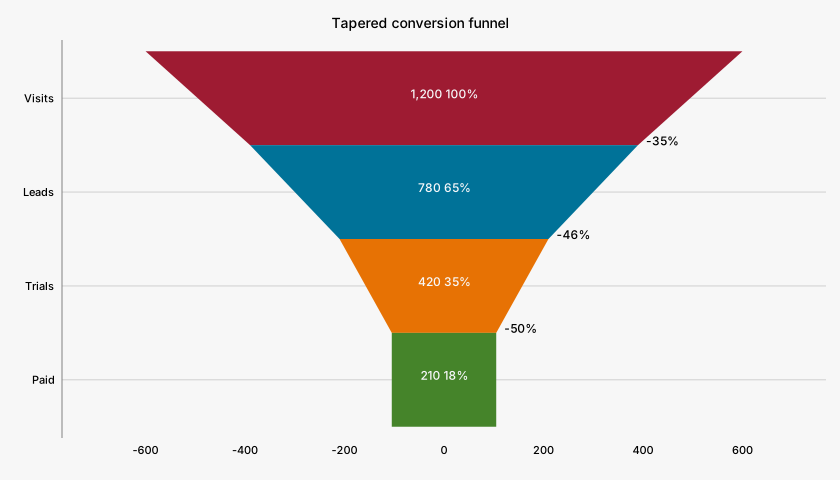
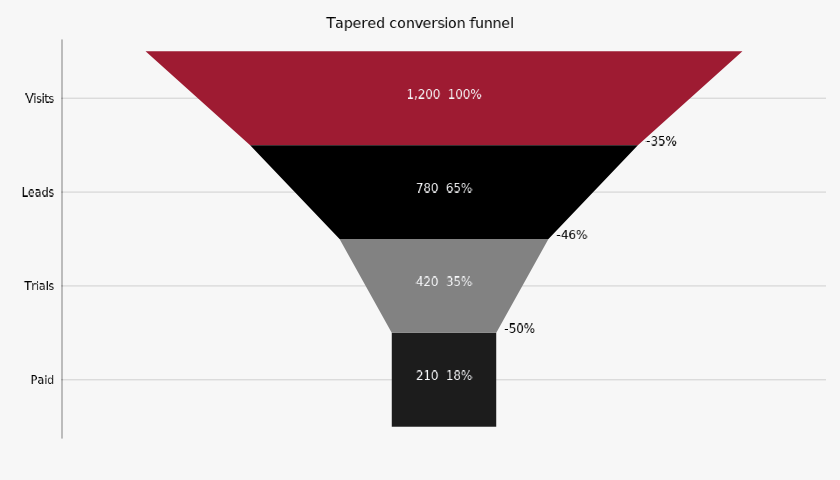
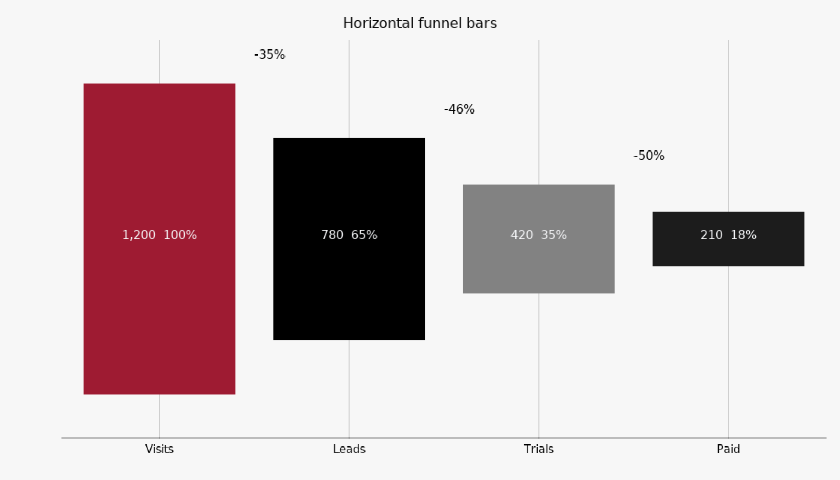
Tapered conversion funnel

#

Four ordered stages retain their original counts and conversion labels.

Tapered conversion funnel, colorset1
Renderer-derived tonesnone
Options and implementation

Area geometry makes a taper whose painted area is not proportional to value; bar geometry uses proportional centered widths. XY 0.0.8 generates native contrast-label paints #f7f8fa/#1f2430 outside the theme; stage fills remain canonical.

xy.funnelxy.funnel_chart

{
  "funnel": [
    "colors",
    "geometry",
    "orientation",
    "opacity",
    "show_values",
    "show_conversion",
    "show_dropoff"
  ],
  "funnel_chart": [
    "navigation"
  ]
}
Fields and flows · CS2

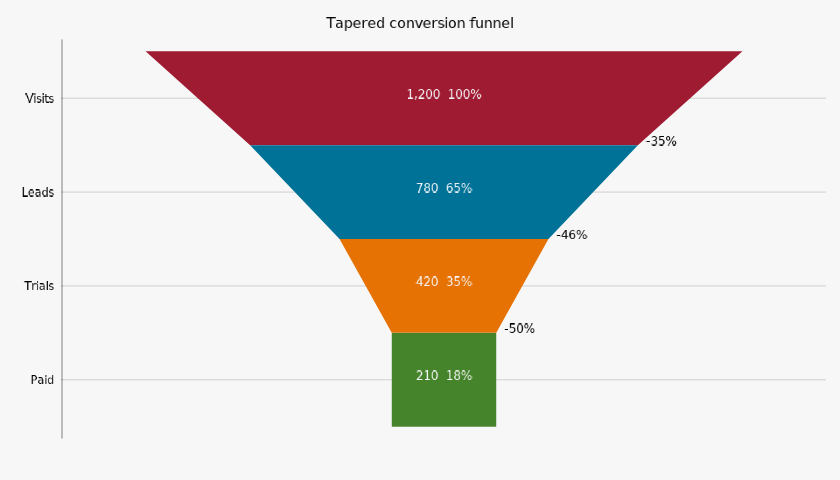
Tapered conversion funnel

#

Four ordered stages retain their original counts and conversion labels.

Tapered conversion funnel, colorset2
Renderer-derived tonesnone
Options and implementation

Area geometry makes a taper whose painted area is not proportional to value; bar geometry uses proportional centered widths. XY 0.0.8 generates native contrast-label paints #f7f8fa/#1f2430 outside the theme; stage fills remain canonical.

xy.funnelxy.funnel_chart

{
  "funnel": [
    "colors",
    "geometry",
    "orientation",
    "opacity",
    "show_values",
    "show_conversion",
    "show_dropoff"
  ],
  "funnel_chart": [
    "navigation"
  ]
}
Fields and flows · CS1

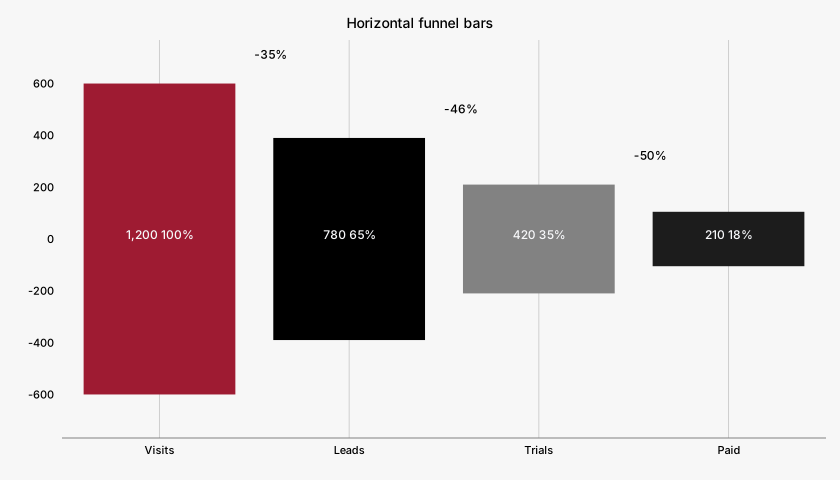
Horizontal funnel bars

#

Four ordered stages retain their original counts and conversion labels.

Horizontal funnel bars, colorset1
Renderer-derived tonesnone
Options and implementation

Area geometry makes a taper whose painted area is not proportional to value; bar geometry uses proportional centered widths. XY 0.0.8 generates native contrast-label paints #f7f8fa/#1f2430 outside the theme; stage fills remain canonical.

xy.funnelxy.funnel_chart

{
  "funnel": [
    "colors",
    "geometry",
    "orientation",
    "opacity",
    "show_values",
    "show_conversion",
    "show_dropoff"
  ],
  "funnel_chart": [
    "navigation"
  ]
}
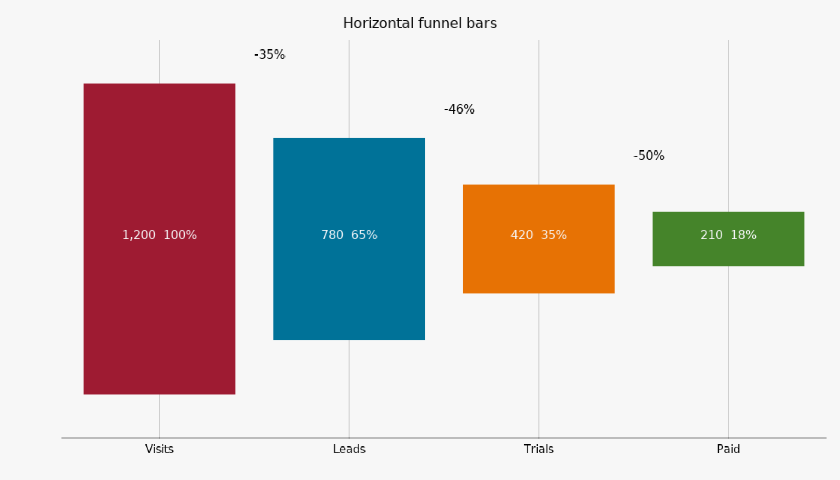
Fields and flows · CS2

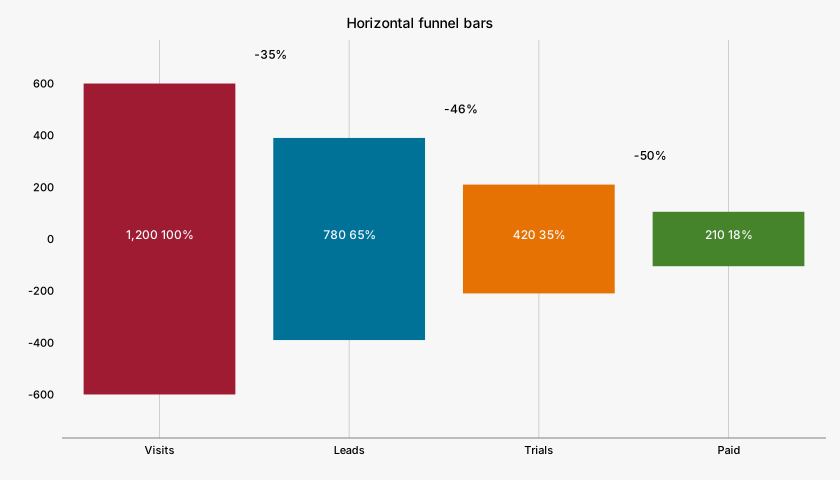
Horizontal funnel bars

#

Four ordered stages retain their original counts and conversion labels.

Horizontal funnel bars, colorset2
Renderer-derived tonesnone
Options and implementation

Area geometry makes a taper whose painted area is not proportional to value; bar geometry uses proportional centered widths. XY 0.0.8 generates native contrast-label paints #f7f8fa/#1f2430 outside the theme; stage fills remain canonical.

xy.funnelxy.funnel_chart

{
  "funnel": [
    "colors",
    "geometry",
    "orientation",
    "opacity",
    "show_values",
    "show_conversion",
    "show_dropoff"
  ],
  "funnel_chart": [
    "navigation"
  ]
}

Polar charts

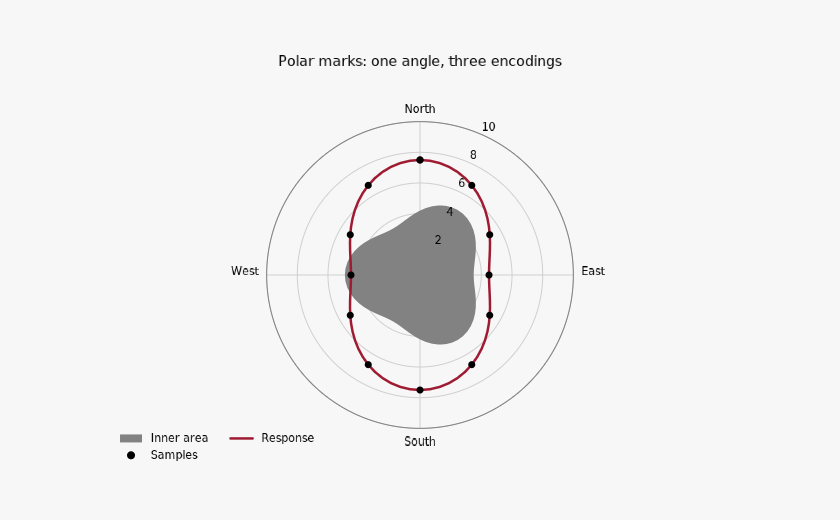
Polar charts · CS1

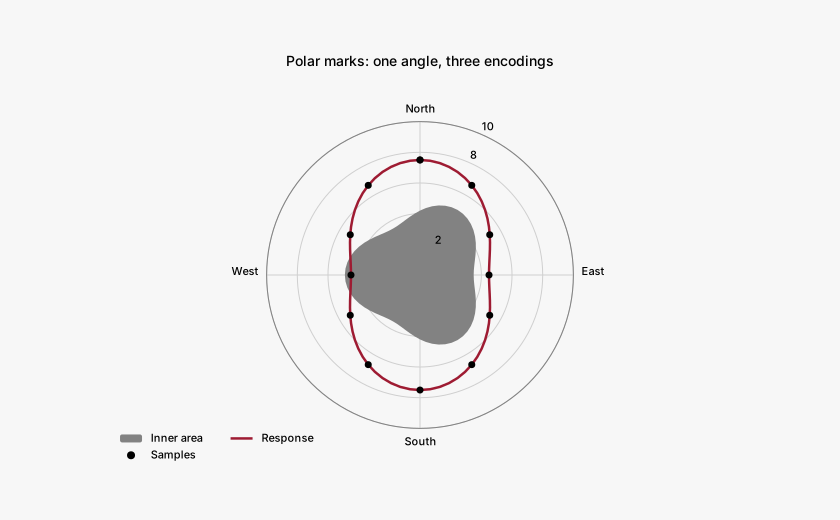
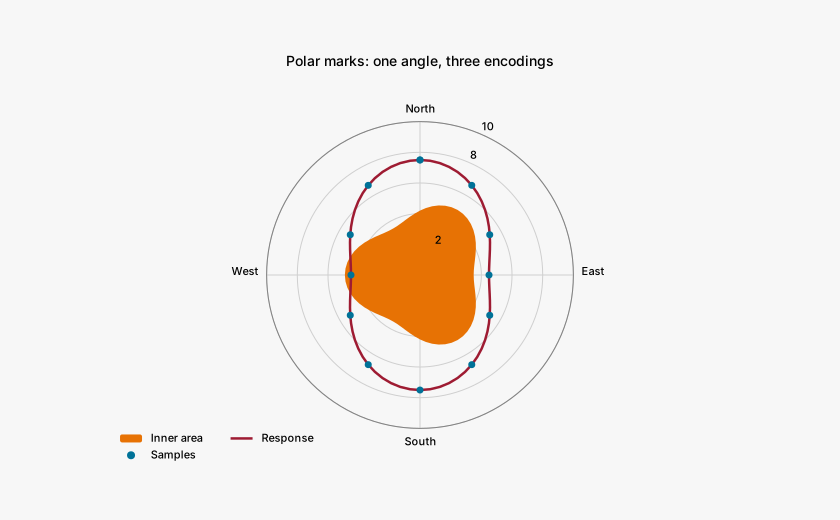
Polar marks: one angle, three encodings

#

Area, line, and sampled points reuse ordinary marks in polar coordinates.

Polar marks: one angle, three encodings, colorset1
Exact palette paintspolar
Options and implementation

Degrees start at North and increase clockwise. The opaque inner region, outer response, and sampled observations share one radial domain. Polar zoom is off by default because the fixed center and full rim are meaningful.

xy.polar_chartxy.areaxy.linexy.scatterxy.theta_axisxy.r_axisxy.legendxy.theme

{
  "polar_chart": [
    "title",
    "width",
    "height",
    "padding"
  ],
  "area": [
    "x",
    "y",
    "color",
    "opacity",
    "line_width",
    "name"
  ],
  "line": [
    "x",
    "y",
    "color",
    "width",
    "name"
  ],
  "scatter": [
    "x",
    "y",
    "color",
    "size",
    "opacity",
    "stroke_width",
    "name"
  ],
  "theta_axis": [
    "unit",
    "zero",
    "direction",
    "tick_values",
    "tick_labels"
  ],
  "r_axis": [
    "domain",
    "tick_values"
  ],
  "legend": [
    "style",
    "loc",
    "anchor",
    "ncols"
  ],
  "theme": [
    "palette"
  ]
}
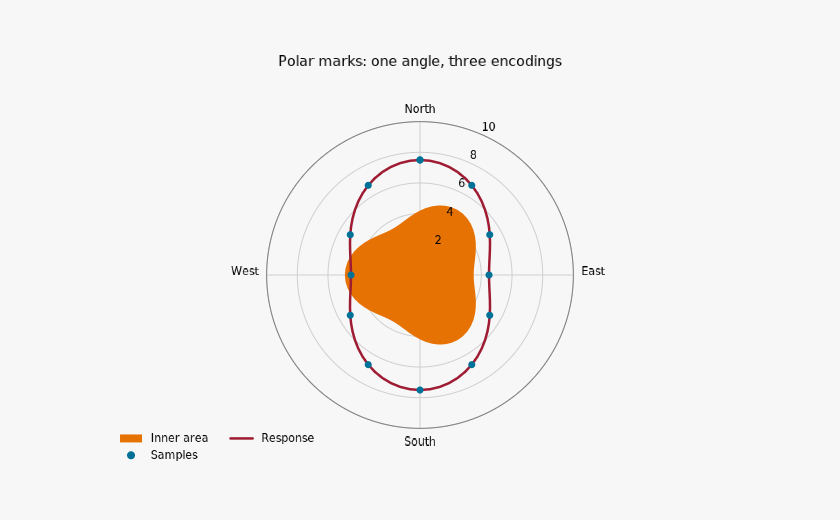
Polar charts · CS2

Polar marks: one angle, three encodings

#

Area, line, and sampled points reuse ordinary marks in polar coordinates.

Polar marks: one angle, three encodings, colorset2
Exact palette paintspolar
Options and implementation

Degrees start at North and increase clockwise. The opaque inner region, outer response, and sampled observations share one radial domain. Polar zoom is off by default because the fixed center and full rim are meaningful.

xy.polar_chartxy.areaxy.linexy.scatterxy.theta_axisxy.r_axisxy.legendxy.theme

{
  "polar_chart": [
    "title",
    "width",
    "height",
    "padding"
  ],
  "area": [
    "x",
    "y",
    "color",
    "opacity",
    "line_width",
    "name"
  ],
  "line": [
    "x",
    "y",
    "color",
    "width",
    "name"
  ],
  "scatter": [
    "x",
    "y",
    "color",
    "size",
    "opacity",
    "stroke_width",
    "name"
  ],
  "theta_axis": [
    "unit",
    "zero",
    "direction",
    "tick_values",
    "tick_labels"
  ],
  "r_axis": [
    "domain",
    "tick_values"
  ],
  "legend": [
    "style",
    "loc",
    "anchor",
    "ncols"
  ],
  "theme": [
    "palette"
  ]
}
Polar charts · CS1

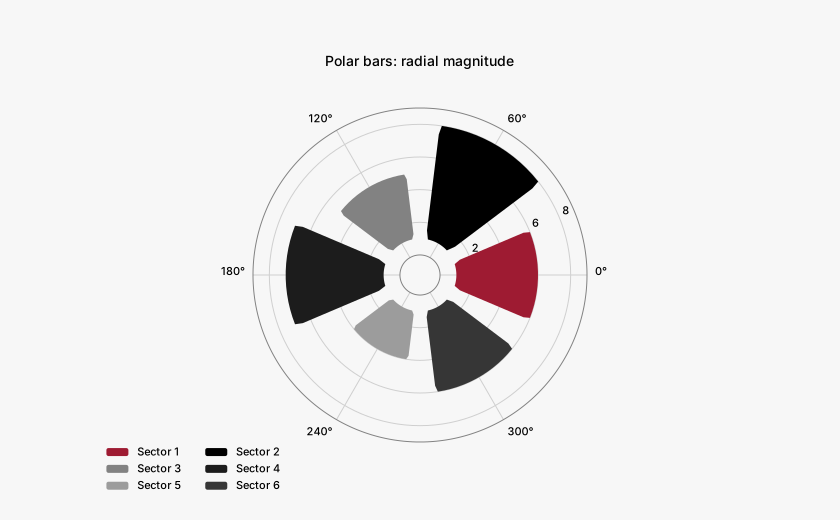
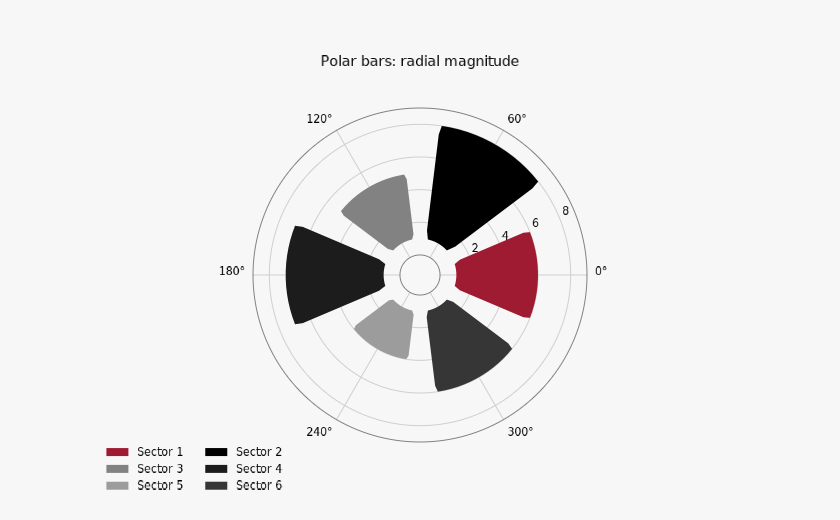
Polar bars: radial magnitude

#

Angular bar widths, annular bases, rounded corners, and pixel gaps.

Polar bars: radial magnitude, colorset1
Exact palette paintspolar
Options and implementation

Each sector is a genuine bar with a one-unit radial base. Angular width is measured in degrees; wedge gaps and corner rounding are renderer geometry. East is zero and angles increase counterclockwise. The two-column legend is anchored below the polar rim so narrow displays keep every angular tick readable.

xy.polar_bar_chartxy.barxy.theta_axisxy.r_axisxy.legendxy.theme

{
  "polar_bar_chart": [
    "title",
    "width",
    "height",
    "padding"
  ],
  "bar": [
    "x",
    "y",
    "base",
    "width",
    "wedge_gap",
    "corner_radius",
    "color",
    "opacity",
    "stroke_width",
    "name"
  ],
  "theta_axis": [
    "unit",
    "zero",
    "direction",
    "tick_values"
  ],
  "r_axis": [
    "domain",
    "hole",
    "tick_values"
  ],
  "legend": [
    "style",
    "loc",
    "anchor",
    "ncols"
  ],
  "theme": [
    "palette"
  ]
}
Polar charts · CS2

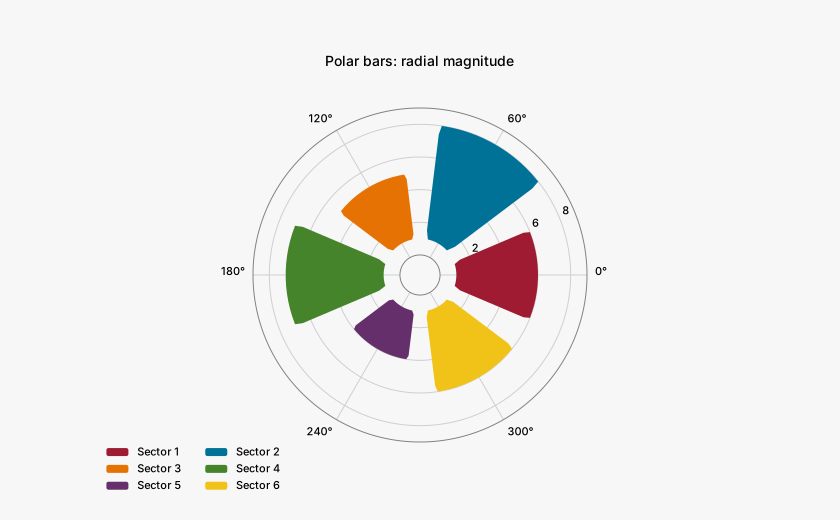
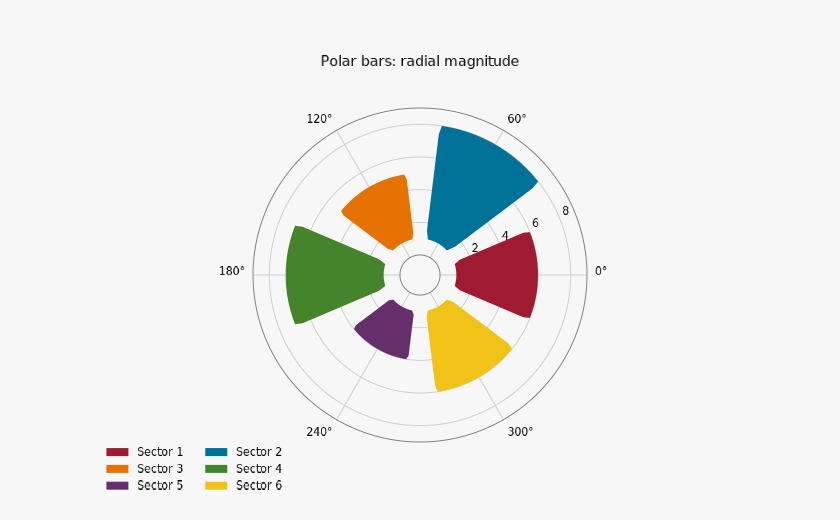
Polar bars: radial magnitude

#

Angular bar widths, annular bases, rounded corners, and pixel gaps.

Polar bars: radial magnitude, colorset2
Exact palette paintspolar
Options and implementation

Each sector is a genuine bar with a one-unit radial base. Angular width is measured in degrees; wedge gaps and corner rounding are renderer geometry. East is zero and angles increase counterclockwise. The two-column legend is anchored below the polar rim so narrow displays keep every angular tick readable.

xy.polar_bar_chartxy.barxy.theta_axisxy.r_axisxy.legendxy.theme

{
  "polar_bar_chart": [
    "title",
    "width",
    "height",
    "padding"
  ],
  "bar": [
    "x",
    "y",
    "base",
    "width",
    "wedge_gap",
    "corner_radius",
    "color",
    "opacity",
    "stroke_width",
    "name"
  ],
  "theta_axis": [
    "unit",
    "zero",
    "direction",
    "tick_values"
  ],
  "r_axis": [
    "domain",
    "hole",
    "tick_values"
  ],
  "legend": [
    "style",
    "loc",
    "anchor",
    "ncols"
  ],
  "theme": [
    "palette"
  ]
}
Polar charts · CS1

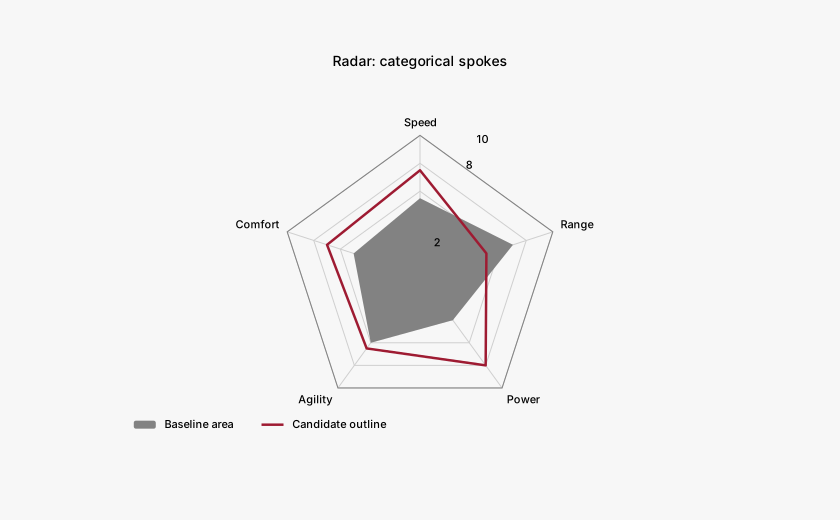
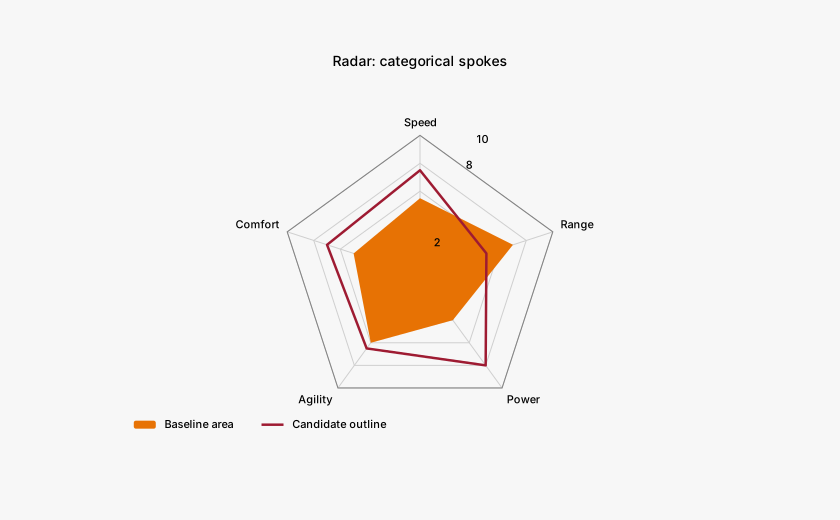
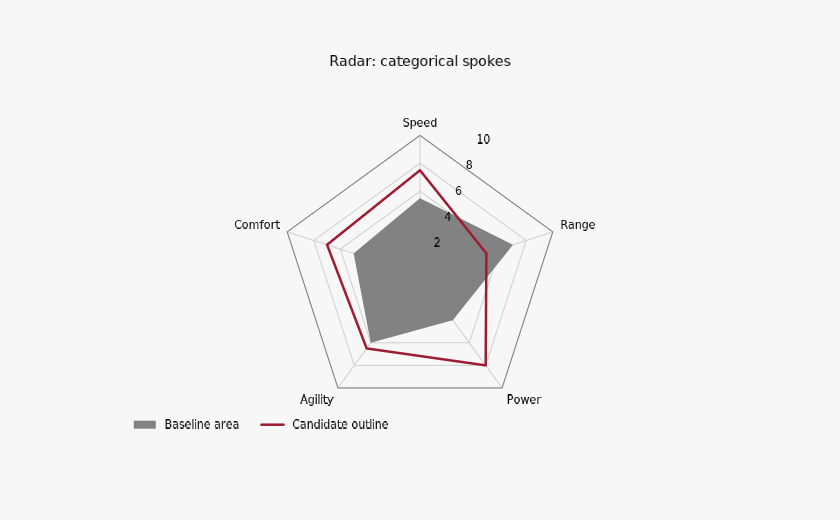
Radar: categorical spokes

#

An opaque area and an outline close automatically across named spokes.

Radar: categorical spokes, colorset1
Exact palette paintspolar
Options and implementation

The public radar factory derives evenly spaced angles and closes the last segment at a full turn. Polygonal grids use theta_axis(grid_shape='linear'); each mark provides exactly one value per category.

xy.radar_chartxy.areaxy.linexy.theta_axisxy.r_axisxy.legendxy.theme

{
  "radar_chart": [
    "categories",
    "fill",
    "title",
    "width",
    "height",
    "padding"
  ],
  "area": [
    "x",
    "color",
    "opacity",
    "line_width",
    "name"
  ],
  "line": [
    "x",
    "color",
    "width",
    "name"
  ],
  "theta_axis": [
    "unit",
    "zero",
    "direction",
    "grid_shape"
  ],
  "r_axis": [
    "domain",
    "tick_values"
  ],
  "legend": [
    "style",
    "loc",
    "anchor",
    "ncols"
  ],
  "theme": [
    "palette"
  ]
}
Polar charts · CS2

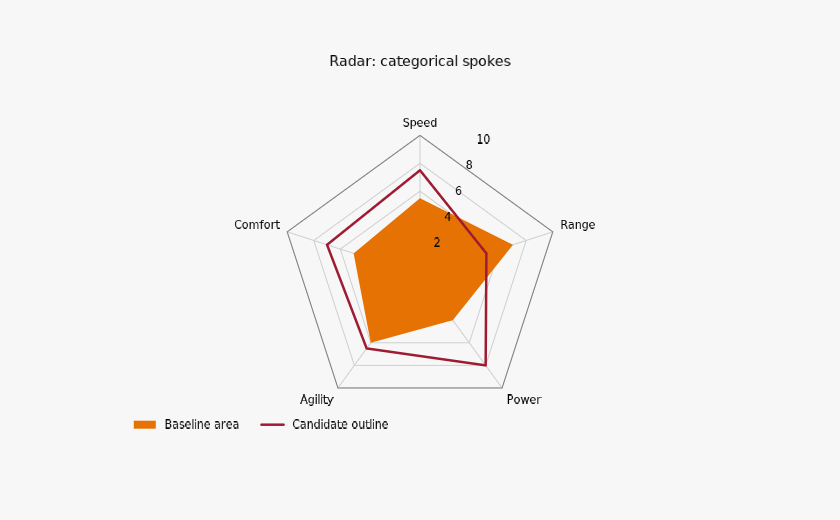
Radar: categorical spokes

#

An opaque area and an outline close automatically across named spokes.

Radar: categorical spokes, colorset2
Exact palette paintspolar
Options and implementation

The public radar factory derives evenly spaced angles and closes the last segment at a full turn. Polygonal grids use theta_axis(grid_shape='linear'); each mark provides exactly one value per category.

xy.radar_chartxy.areaxy.linexy.theta_axisxy.r_axisxy.legendxy.theme

{
  "radar_chart": [
    "categories",
    "fill",
    "title",
    "width",
    "height",
    "padding"
  ],
  "area": [
    "x",
    "color",
    "opacity",
    "line_width",
    "name"
  ],
  "line": [
    "x",
    "color",
    "width",
    "name"
  ],
  "theta_axis": [
    "unit",
    "zero",
    "direction",
    "grid_shape"
  ],
  "r_axis": [
    "domain",
    "tick_values"
  ],
  "legend": [
    "style",
    "loc",
    "anchor",
    "ncols"
  ],
  "theme": [
    "palette"
  ]
}
Polar charts · CS1

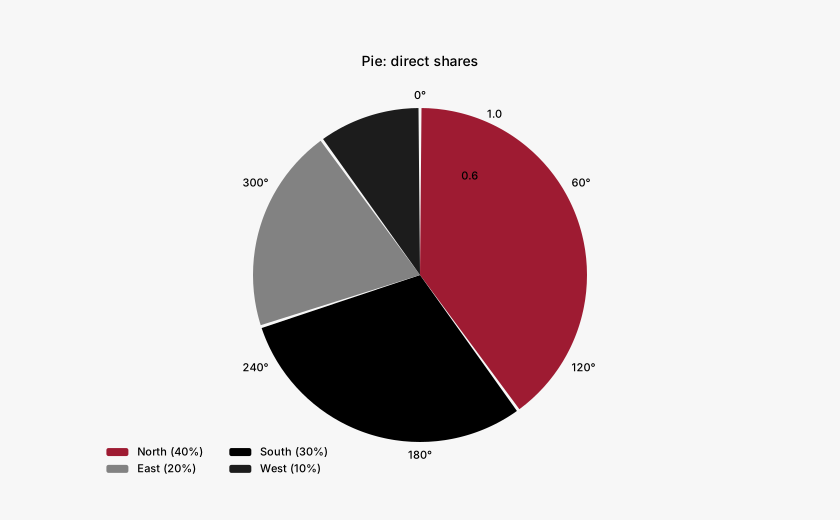
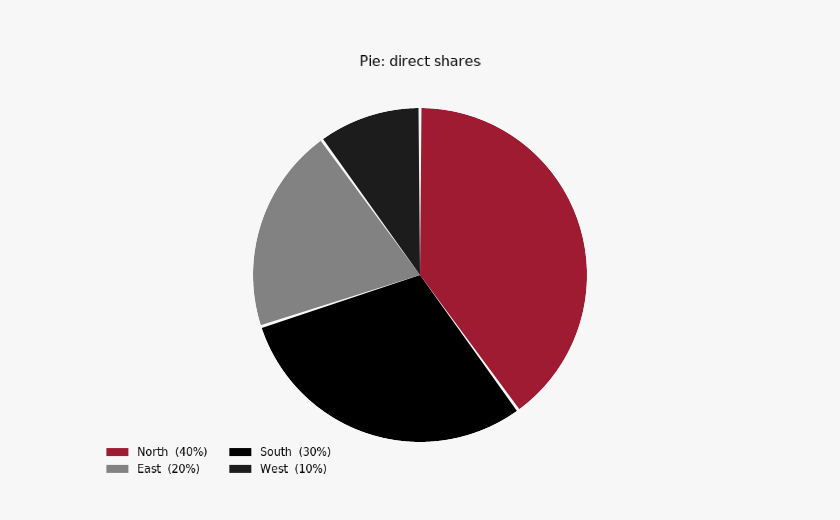
Pie: direct shares

#

The pie factory computes angular shares, values, and percentages.

Pie: direct shares, colorset1
Exact palette paintspolar
Options and implementation

hole=0 selects this solid pie. The four values total 100. Public generated Mark.props set opacity=1 before compilation, replacing the factory's translucent bar default; computed slice spans and tooltips are unchanged.

xy.pie_chartxy.Markxy.legendxy.theme

{
  "pie_chart": [
    "labels",
    "values",
    "hole",
    "pad",
    "colors",
    "corner_radius",
    "show_values",
    "show_percent",
    "title",
    "width",
    "height",
    "padding"
  ],
  "Mark": [
    "props"
  ],
  "legend": [
    "style",
    "loc",
    "anchor",
    "ncols"
  ],
  "theme": [
    "palette"
  ]
}
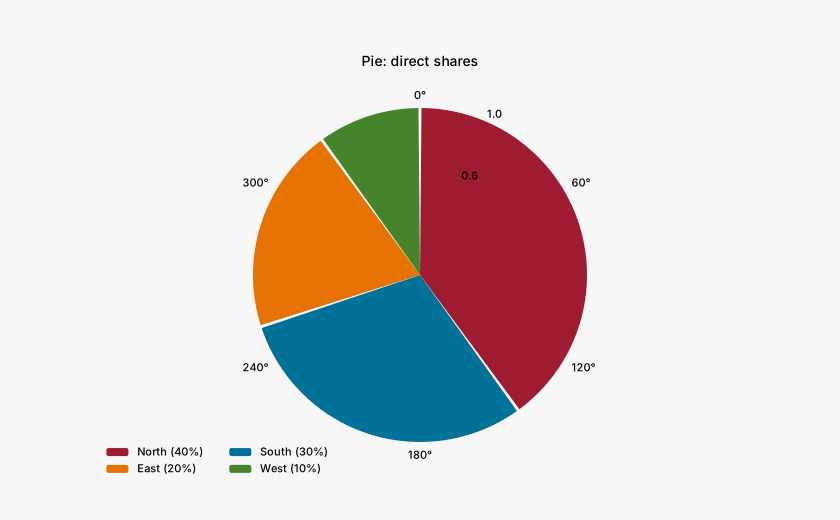
Polar charts · CS2

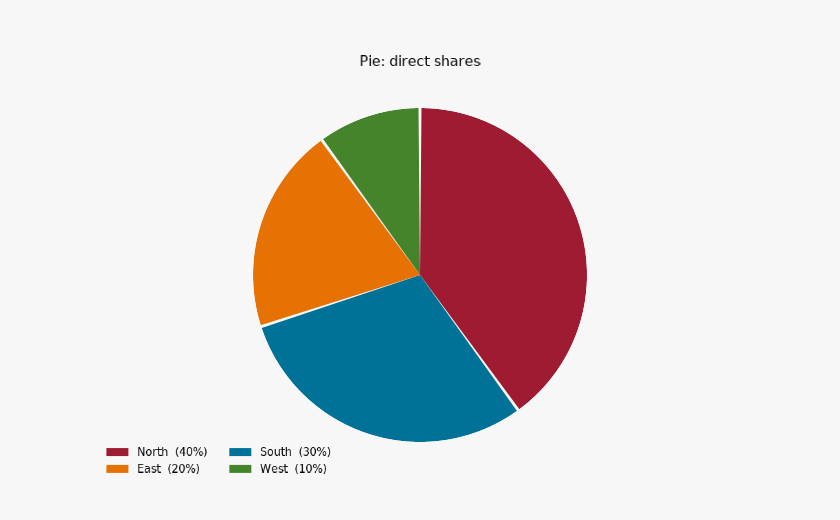
Pie: direct shares

#

The pie factory computes angular shares, values, and percentages.

Pie: direct shares, colorset2
Exact palette paintspolar
Options and implementation

hole=0 selects this solid pie. The four values total 100. Public generated Mark.props set opacity=1 before compilation, replacing the factory's translucent bar default; computed slice spans and tooltips are unchanged.

xy.pie_chartxy.Markxy.legendxy.theme

{
  "pie_chart": [
    "labels",
    "values",
    "hole",
    "pad",
    "colors",
    "corner_radius",
    "show_values",
    "show_percent",
    "title",
    "width",
    "height",
    "padding"
  ],
  "Mark": [
    "props"
  ],
  "legend": [
    "style",
    "loc",
    "anchor",
    "ncols"
  ],
  "theme": [
    "palette"
  ]
}
Polar charts · CS1

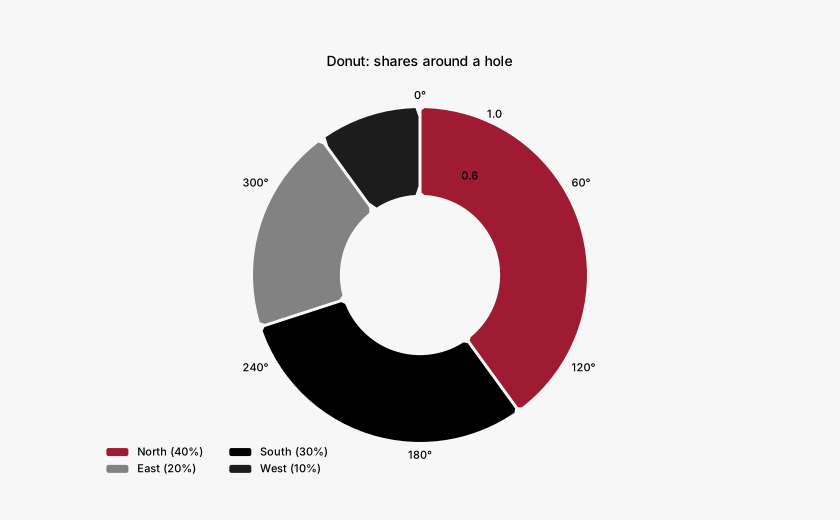
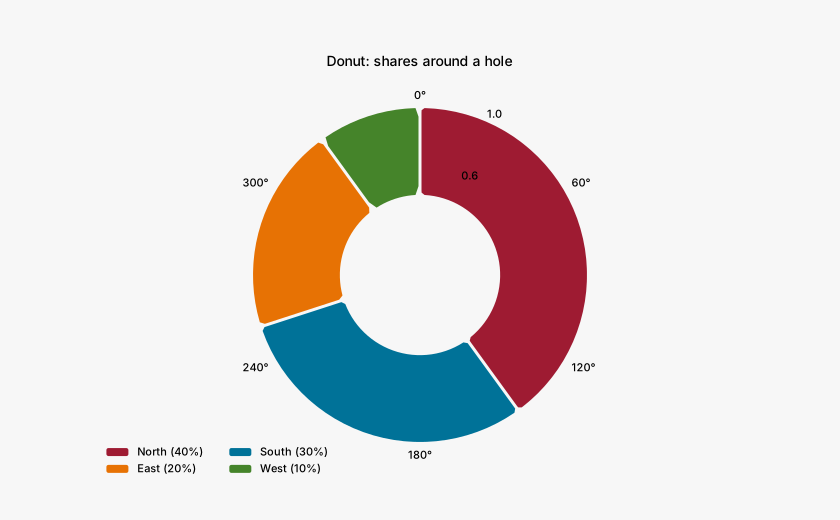
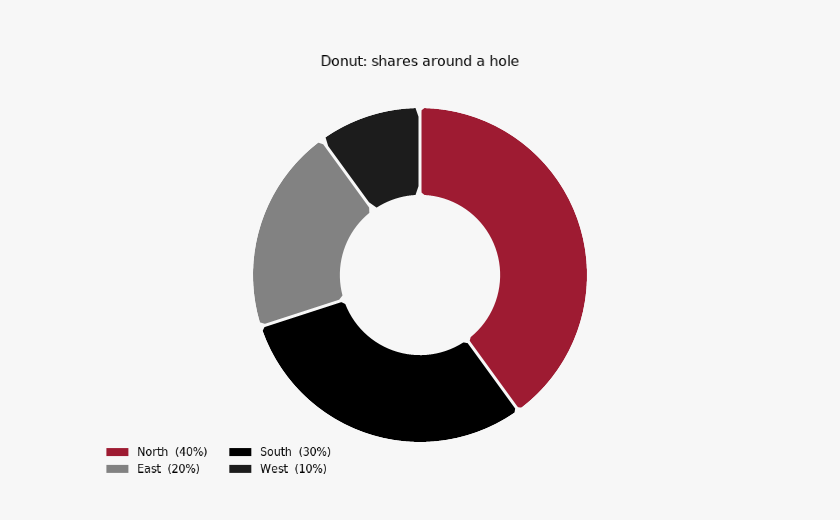
Donut: shares around a hole

#

The pie factory computes angular shares, values, and percentages.

Donut: shares around a hole, colorset1
Exact palette paintspolar
Options and implementation

hole=0.48 selects this donut. The four values total 100. Public generated Mark.props set opacity=1 before compilation, replacing the factory's translucent bar default; computed slice spans and tooltips are unchanged.

xy.pie_chartxy.Markxy.legendxy.theme

{
  "pie_chart": [
    "labels",
    "values",
    "hole",
    "pad",
    "colors",
    "corner_radius",
    "show_values",
    "show_percent",
    "title",
    "width",
    "height",
    "padding"
  ],
  "Mark": [
    "props"
  ],
  "legend": [
    "style",
    "loc",
    "anchor",
    "ncols"
  ],
  "theme": [
    "palette"
  ]
}
Polar charts · CS2

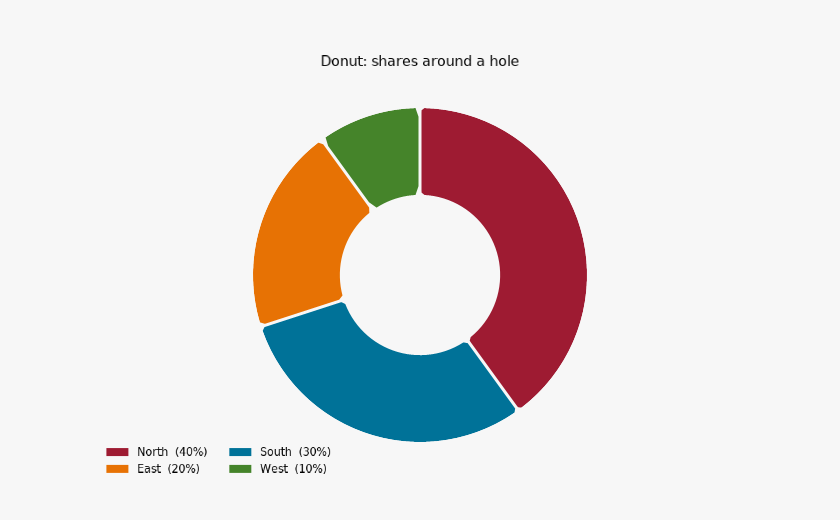
Donut: shares around a hole

#

The pie factory computes angular shares, values, and percentages.

Donut: shares around a hole, colorset2
Exact palette paintspolar
Options and implementation

hole=0.48 selects this donut. The four values total 100. Public generated Mark.props set opacity=1 before compilation, replacing the factory's translucent bar default; computed slice spans and tooltips are unchanged.

xy.pie_chartxy.Markxy.legendxy.theme

{
  "pie_chart": [
    "labels",
    "values",
    "hole",
    "pad",
    "colors",
    "corner_radius",
    "show_values",
    "show_percent",
    "title",
    "width",
    "height",
    "padding"
  ],
  "Mark": [
    "props"
  ],
  "legend": [
    "style",
    "loc",
    "anchor",
    "ncols"
  ],
  "theme": [
    "palette"
  ]
}
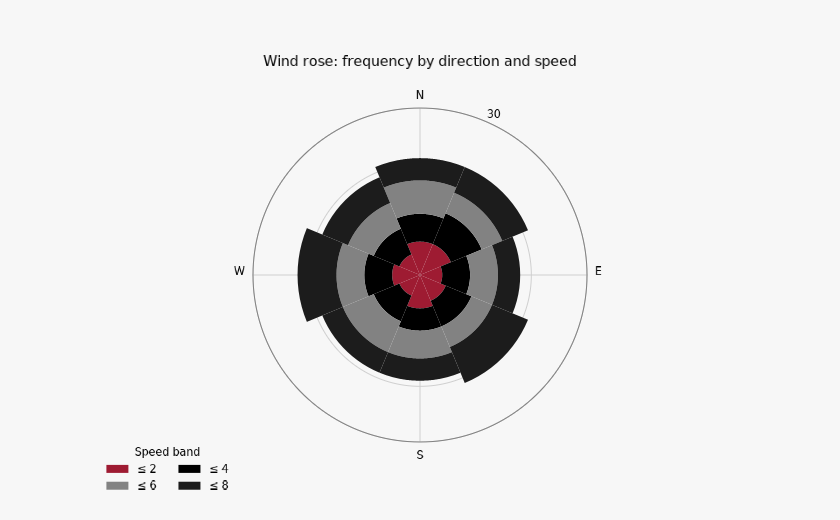
Polar charts · CS1

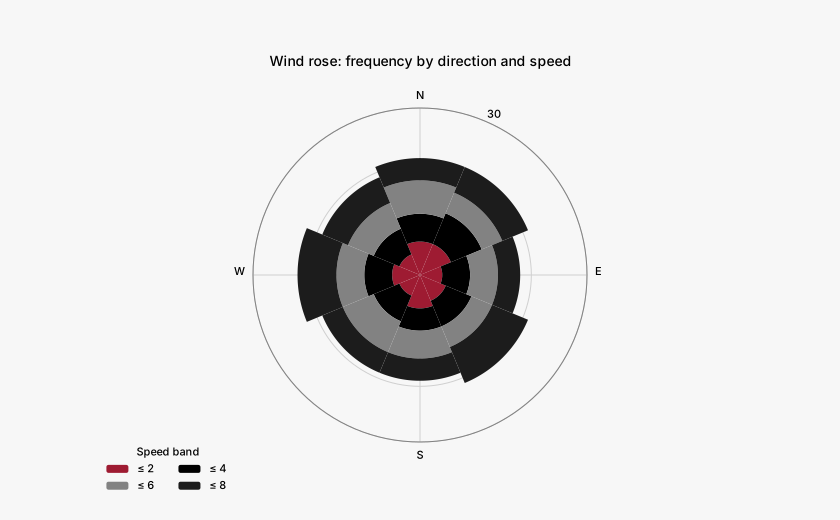
Wind rose: frequency by direction and speed

#

160 observations aggregate into eight directions and four speed bands.

Wind rose: frequency by direction and speed, colorset1
Exact palette paintspolar
Options and implementation

The public factory bins observations and stacks their frequency counts. The highest authored speed edge covers every observation. Public Mark paint props make each generated band opaque. Inner ring labels are omitted so dark solid bands retain legible labels; the outer ring is 30. Wind-rose radial zoom is enabled by default because radius measures a frequency count.

xy.wind_rosexy.Markxy.theta_axisxy.r_axisxy.legendxy.theme

{
  "wind_rose": [
    "directions",
    "speeds",
    "sectors",
    "speed_bins",
    "title",
    "width",
    "height",
    "padding"
  ],
  "Mark": [
    "props"
  ],
  "theta_axis": [
    "unit",
    "zero",
    "direction",
    "tick_values",
    "tick_labels"
  ],
  "r_axis": [
    "domain",
    "tick_values",
    "tick_labels"
  ],
  "legend": [
    "style",
    "loc",
    "title",
    "anchor",
    "ncols"
  ],
  "theme": [
    "palette"
  ]
}
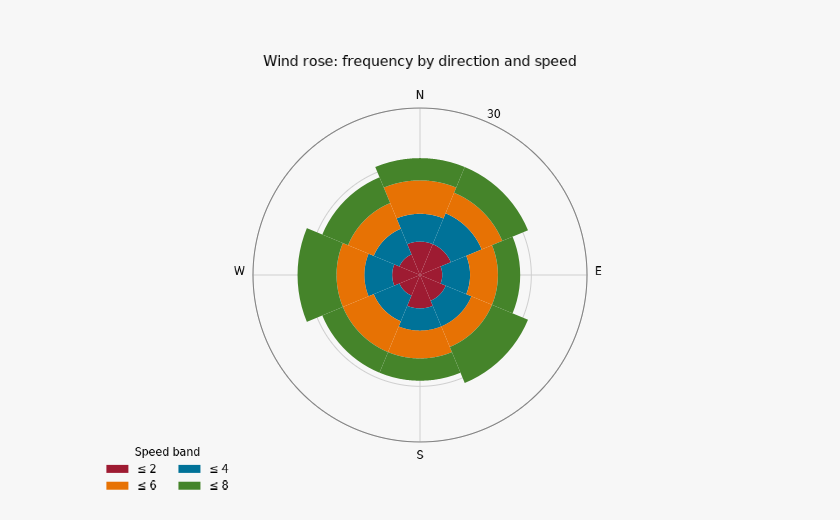
Polar charts · CS2

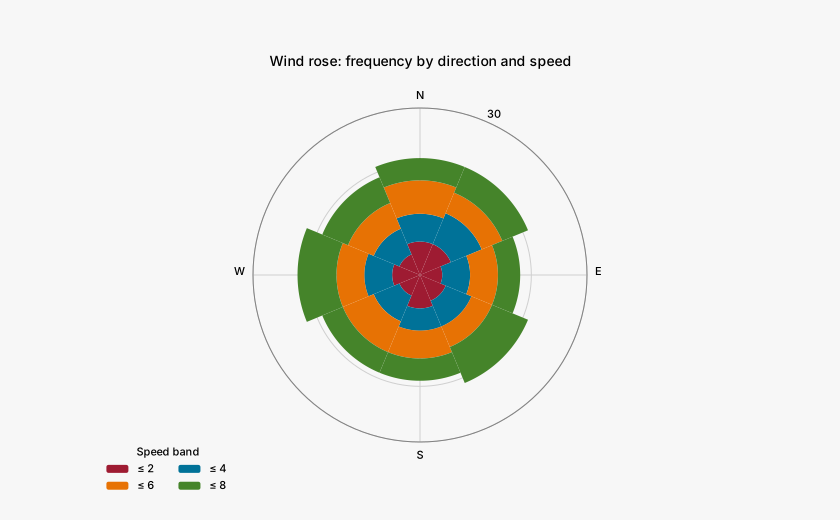
Wind rose: frequency by direction and speed

#

160 observations aggregate into eight directions and four speed bands.

Wind rose: frequency by direction and speed, colorset2
Exact palette paintspolar
Options and implementation

The public factory bins observations and stacks their frequency counts. The highest authored speed edge covers every observation. Public Mark paint props make each generated band opaque. Inner ring labels are omitted so dark solid bands retain legible labels; the outer ring is 30. Wind-rose radial zoom is enabled by default because radius measures a frequency count.

xy.wind_rosexy.Markxy.theta_axisxy.r_axisxy.legendxy.theme

{
  "wind_rose": [
    "directions",
    "speeds",
    "sectors",
    "speed_bins",
    "title",
    "width",
    "height",
    "padding"
  ],
  "Mark": [
    "props"
  ],
  "theta_axis": [
    "unit",
    "zero",
    "direction",
    "tick_values",
    "tick_labels"
  ],
  "r_axis": [
    "domain",
    "tick_values",
    "tick_labels"
  ],
  "legend": [
    "style",
    "loc",
    "title",
    "anchor",
    "ncols"
  ],
  "theme": [
    "palette"
  ]
}
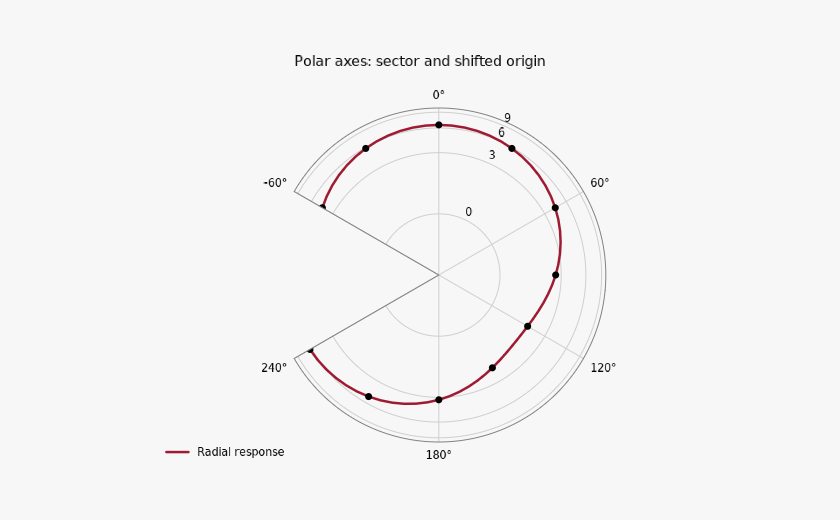
Polar charts · CS1

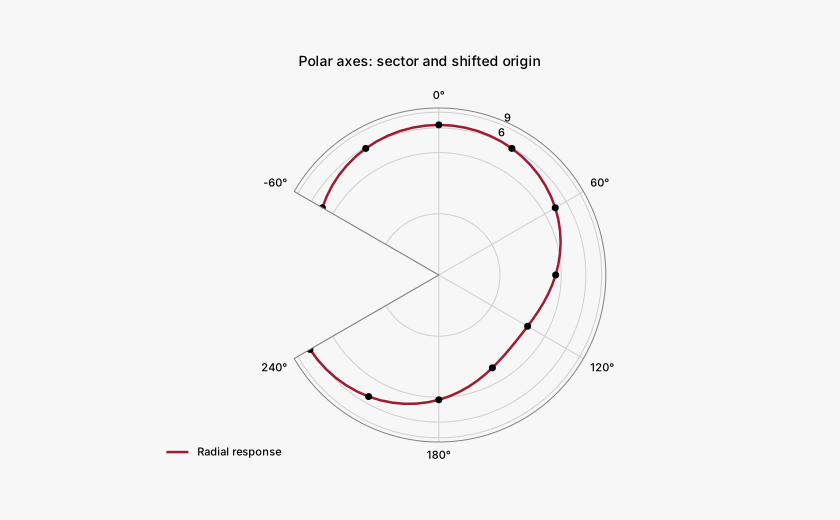
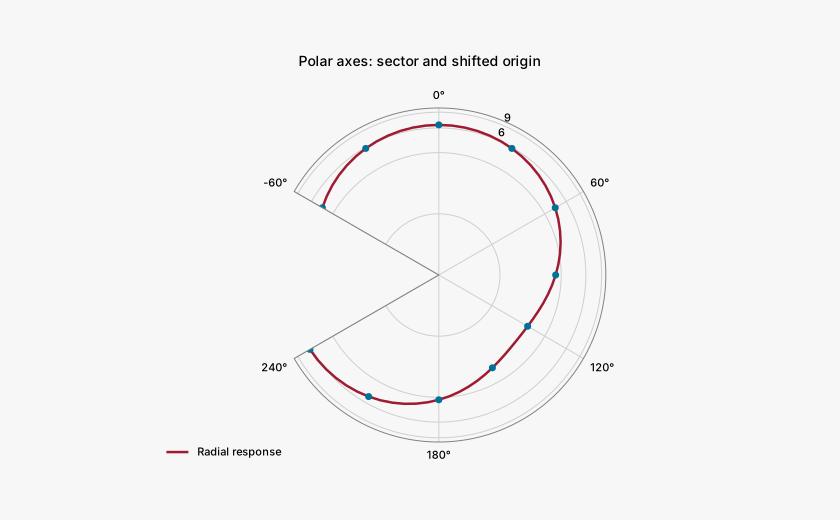
Polar axes: sector and shifted origin

#

A partial angular sector and a symmetric-log radius retain their geometry.

Polar axes: sector and shifted origin, colorset1
Exact palette paintspolar
Options and implementation

The theta sector spans -60 to 240 degrees. A shifted radial origin of -3 is an explicit frame choice; symlog uses a one-unit linear region around zero. The same projection is exported natively.

xy.polar_chartxy.linexy.scatterxy.theta_axisxy.r_axisxy.legendxy.theme

{
  "polar_chart": [
    "title",
    "width",
    "height",
    "padding"
  ],
  "line": [
    "x",
    "y",
    "color",
    "width",
    "name"
  ],
  "scatter": [
    "x",
    "y",
    "color",
    "size",
    "opacity",
    "stroke_width"
  ],
  "theta_axis": [
    "unit",
    "zero",
    "direction",
    "sector",
    "grid_shape",
    "tick_values"
  ],
  "r_axis": [
    "type_",
    "constant",
    "domain",
    "origin",
    "tick_values"
  ],
  "legend": [
    "style",
    "loc",
    "anchor",
    "ncols"
  ],
  "theme": [
    "palette"
  ]
}
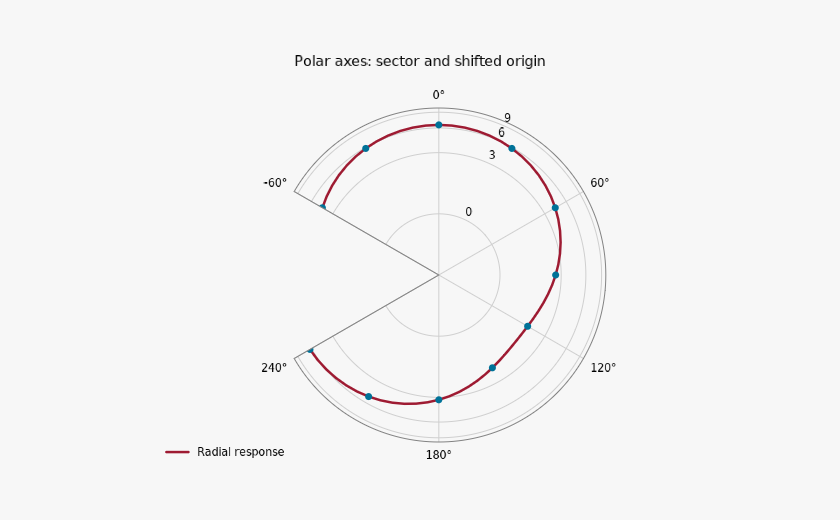
Polar charts · CS2

Polar axes: sector and shifted origin

#

A partial angular sector and a symmetric-log radius retain their geometry.

Polar axes: sector and shifted origin, colorset2
Exact palette paintspolar
Options and implementation

The theta sector spans -60 to 240 degrees. A shifted radial origin of -3 is an explicit frame choice; symlog uses a one-unit linear region around zero. The same projection is exported natively.

xy.polar_chartxy.linexy.scatterxy.theta_axisxy.r_axisxy.legendxy.theme

{
  "polar_chart": [
    "title",
    "width",
    "height",
    "padding"
  ],
  "line": [
    "x",
    "y",
    "color",
    "width",
    "name"
  ],
  "scatter": [
    "x",
    "y",
    "color",
    "size",
    "opacity",
    "stroke_width"
  ],
  "theta_axis": [
    "unit",
    "zero",
    "direction",
    "sector",
    "grid_shape",
    "tick_values"
  ],
  "r_axis": [
    "type_",
    "constant",
    "domain",
    "origin",
    "tick_values"
  ],
  "legend": [
    "style",
    "loc",
    "anchor",
    "ncols"
  ],
  "theme": [
    "palette"
  ]
}

Annotations

Annotations · CS1

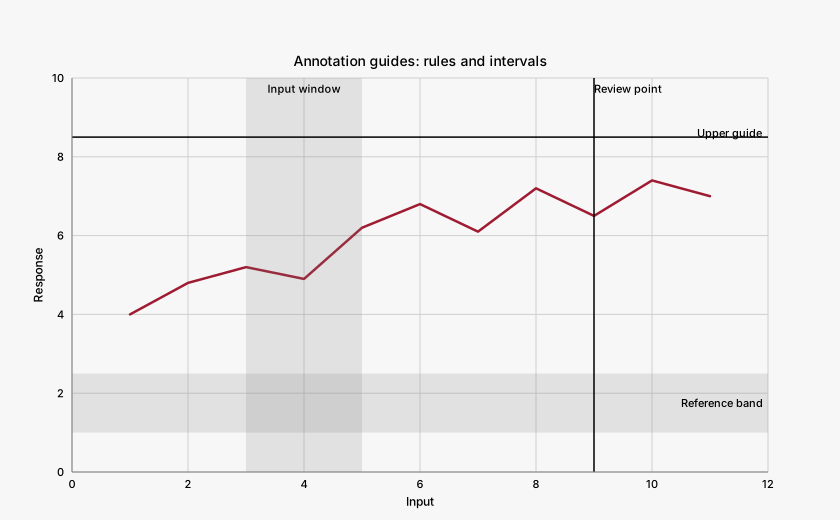
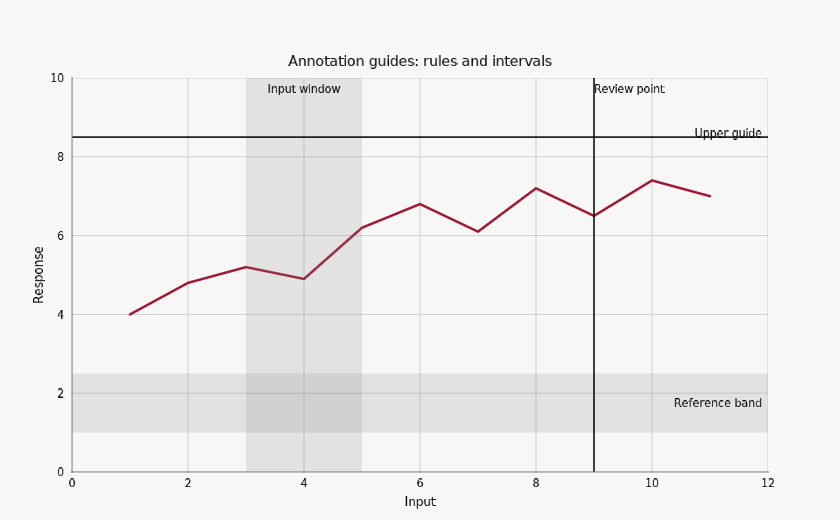
Annotation guides: rules and intervals

#

Horizontal and vertical rules complement intervals on both axes.

Annotation guides: rules and intervals, colorset1
Renderer-derived tonescartesian
Options and implementation

x_band and y_band use canonical neutral paints at 18% alpha so the observed line remains visible. Their composite pixels are derived colors. Rules preserve their measurement meaning as thin semantic lines. The original observed response remains a separate red line.

xy.chartxy.x_bandxy.y_bandxy.hlinexy.vlinexy.linexy.x_axisxy.y_axisxy.legendxy.theme

{
  "chart": [
    "title",
    "width",
    "height",
    "padding"
  ],
  "x_band": [
    "x0",
    "x1",
    "text",
    "color",
    "opacity",
    "style"
  ],
  "y_band": [
    "y0",
    "y1",
    "text",
    "color",
    "opacity",
    "style"
  ],
  "hline": [
    "y",
    "text",
    "color",
    "width",
    "opacity"
  ],
  "vline": [
    "x",
    "text",
    "color",
    "width",
    "opacity"
  ],
  "line": [
    "x",
    "y",
    "color",
    "width"
  ],
  "x_axis": [
    "label",
    "domain",
    "tick_count"
  ],
  "y_axis": [
    "label",
    "domain",
    "tick_count"
  ],
  "legend": [
    "show"
  ],
  "theme": [
    "palette"
  ]
}
Annotations · CS2

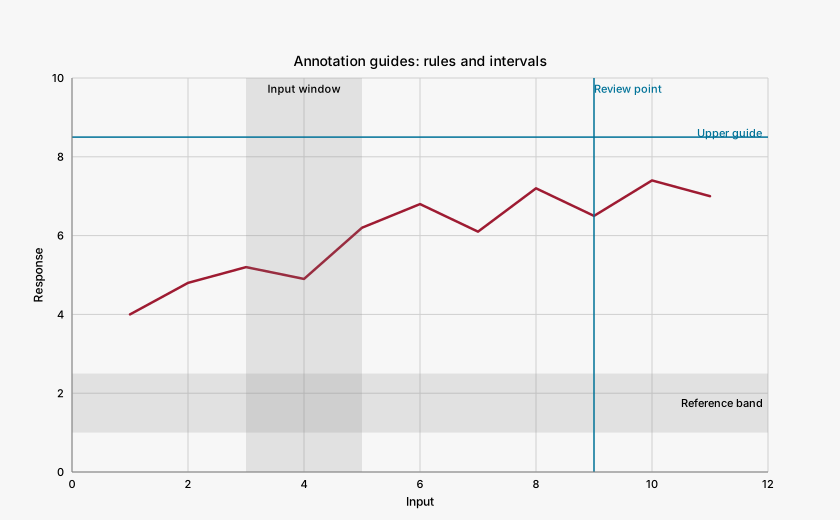
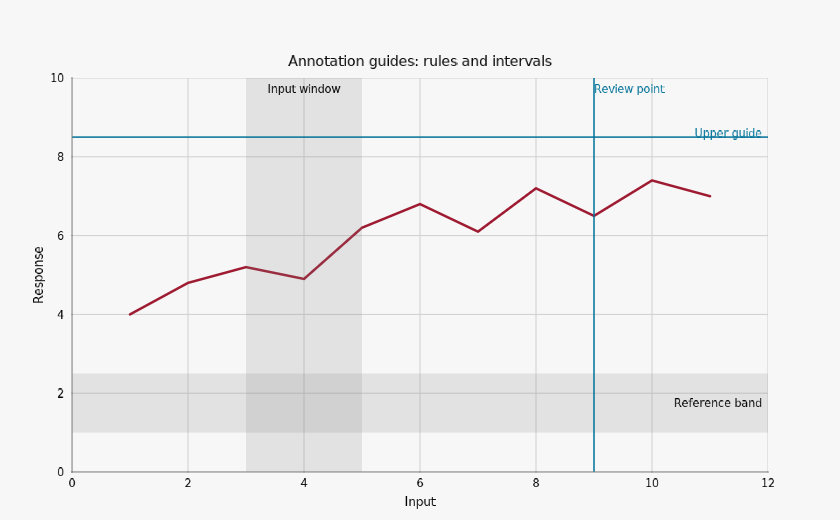
Annotation guides: rules and intervals

#

Horizontal and vertical rules complement intervals on both axes.

Annotation guides: rules and intervals, colorset2
Renderer-derived tonescartesian
Options and implementation

x_band and y_band use canonical neutral paints at 18% alpha so the observed line remains visible. Their composite pixels are derived colors. Rules preserve their measurement meaning as thin semantic lines. The original observed response remains a separate red line.

xy.chartxy.x_bandxy.y_bandxy.hlinexy.vlinexy.linexy.x_axisxy.y_axisxy.legendxy.theme

{
  "chart": [
    "title",
    "width",
    "height",
    "padding"
  ],
  "x_band": [
    "x0",
    "x1",
    "text",
    "color",
    "opacity",
    "style"
  ],
  "y_band": [
    "y0",
    "y1",
    "text",
    "color",
    "opacity",
    "style"
  ],
  "hline": [
    "y",
    "text",
    "color",
    "width",
    "opacity"
  ],
  "vline": [
    "x",
    "text",
    "color",
    "width",
    "opacity"
  ],
  "line": [
    "x",
    "y",
    "color",
    "width"
  ],
  "x_axis": [
    "label",
    "domain",
    "tick_count"
  ],
  "y_axis": [
    "label",
    "domain",
    "tick_count"
  ],
  "legend": [
    "show"
  ],
  "theme": [
    "palette"
  ]
}
Annotations · CS1

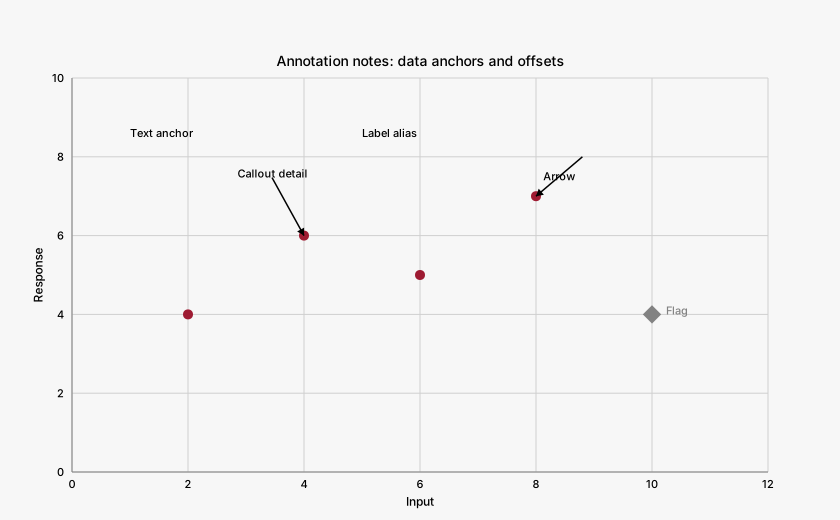
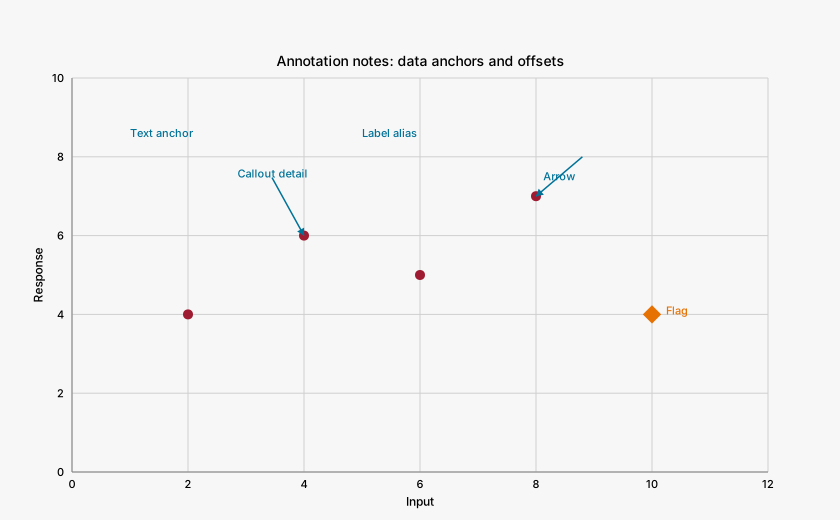
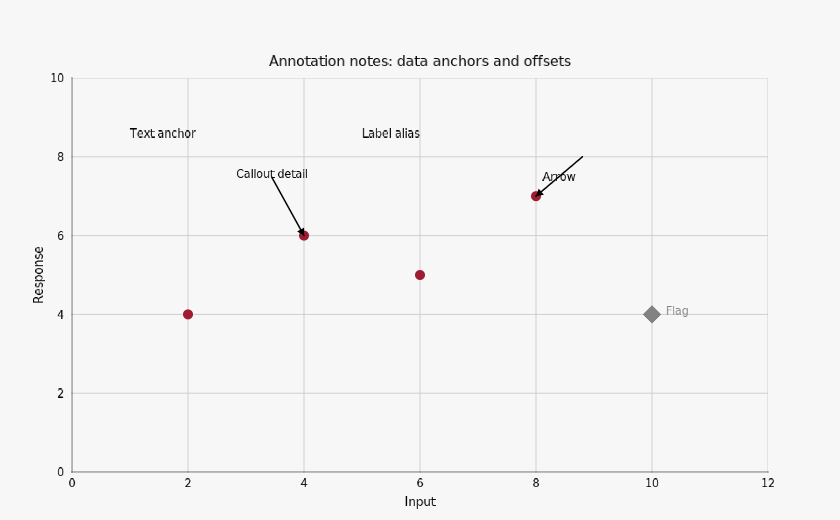
Annotation notes: data anchors and offsets

#

Text, labels, arrows, callouts, and a semantic marker stay anchored to data.

Annotation notes: data anchors and offsets, colorset1
Exact palette paintscartesian
Options and implementation

Text and label are equivalent authoring entry points. Callout offsets are pixels while their anchor remains a data coordinate. The annotation marker has an explicit symbol, fill, and zero decorative outline.

xy.chartxy.scatterxy.textxy.labelxy.arrowxy.calloutxy.markerxy.x_axisxy.y_axisxy.legendxy.theme

{
  "chart": [
    "title",
    "width",
    "height",
    "padding"
  ],
  "scatter": [
    "x",
    "y",
    "color",
    "size",
    "opacity",
    "stroke_width"
  ],
  "text": [
    "x",
    "y",
    "value",
    "dx",
    "dy",
    "color",
    "anchor"
  ],
  "label": [
    "x",
    "y",
    "value",
    "dx",
    "dy",
    "color",
    "anchor"
  ],
  "arrow": [
    "x0",
    "y0",
    "x1",
    "y1",
    "text",
    "color",
    "width",
    "opacity"
  ],
  "callout": [
    "x",
    "y",
    "value",
    "dx",
    "dy",
    "color",
    "width",
    "opacity",
    "anchor"
  ],
  "marker": [
    "x",
    "y",
    "text",
    "color",
    "size",
    "symbol",
    "stroke_color",
    "stroke_width",
    "opacity",
    "dx",
    "dy",
    "anchor"
  ],
  "x_axis": [
    "label",
    "domain",
    "tick_count"
  ],
  "y_axis": [
    "label",
    "domain",
    "tick_count"
  ],
  "legend": [
    "show"
  ],
  "theme": [
    "palette"
  ]
}
Annotations · CS2

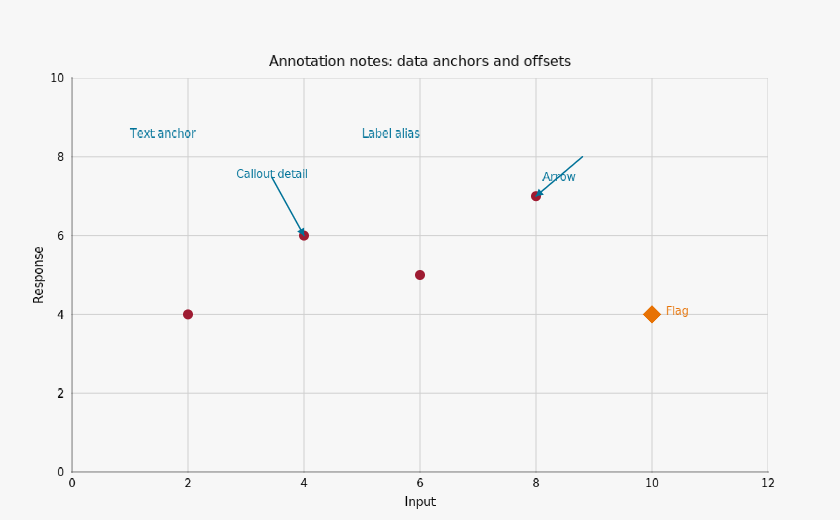
Annotation notes: data anchors and offsets

#

Text, labels, arrows, callouts, and a semantic marker stay anchored to data.

Annotation notes: data anchors and offsets, colorset2
Exact palette paintscartesian
Options and implementation

Text and label are equivalent authoring entry points. Callout offsets are pixels while their anchor remains a data coordinate. The annotation marker has an explicit symbol, fill, and zero decorative outline.

xy.chartxy.scatterxy.textxy.labelxy.arrowxy.calloutxy.markerxy.x_axisxy.y_axisxy.legendxy.theme

{
  "chart": [
    "title",
    "width",
    "height",
    "padding"
  ],
  "scatter": [
    "x",
    "y",
    "color",
    "size",
    "opacity",
    "stroke_width"
  ],
  "text": [
    "x",
    "y",
    "value",
    "dx",
    "dy",
    "color",
    "anchor"
  ],
  "label": [
    "x",
    "y",
    "value",
    "dx",
    "dy",
    "color",
    "anchor"
  ],
  "arrow": [
    "x0",
    "y0",
    "x1",
    "y1",
    "text",
    "color",
    "width",
    "opacity"
  ],
  "callout": [
    "x",
    "y",
    "value",
    "dx",
    "dy",
    "color",
    "width",
    "opacity",
    "anchor"
  ],
  "marker": [
    "x",
    "y",
    "text",
    "color",
    "size",
    "symbol",
    "stroke_color",
    "stroke_width",
    "opacity",
    "dx",
    "dy",
    "anchor"
  ],
  "x_axis": [
    "label",
    "domain",
    "tick_count"
  ],
  "y_axis": [
    "label",
    "domain",
    "tick_count"
  ],
  "legend": [
    "show"
  ],
  "theme": [
    "palette"
  ]
}
Annotations · CS1

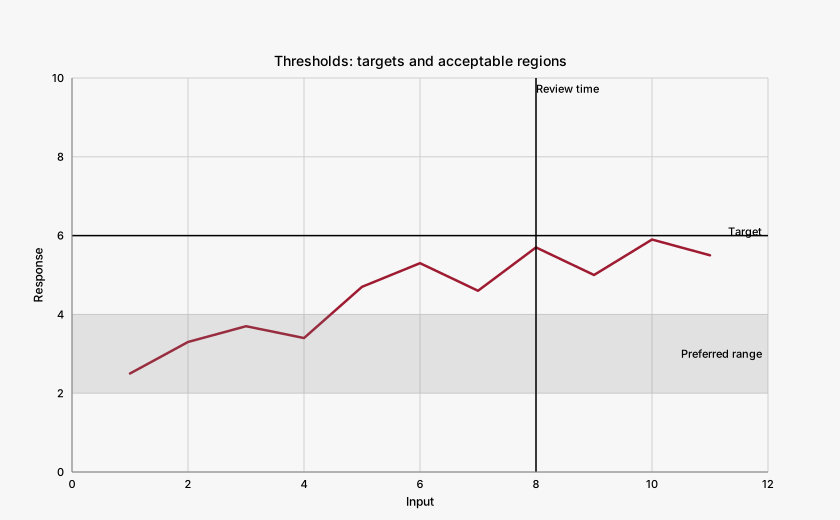
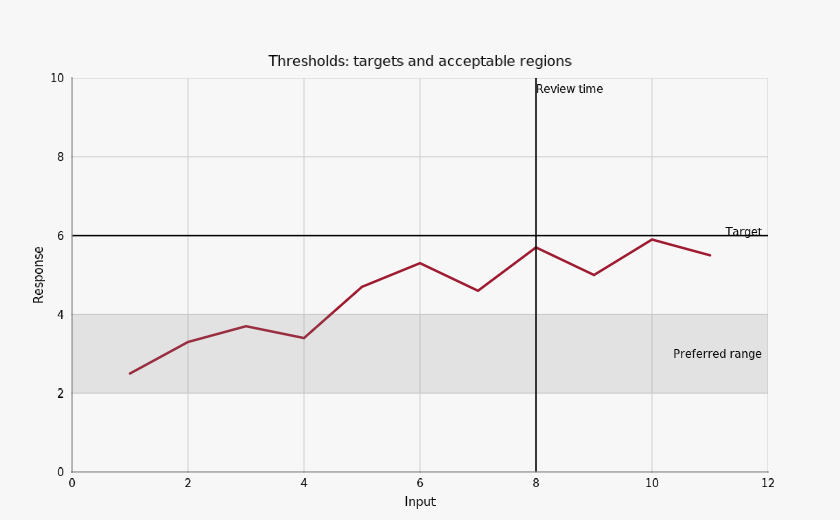
Thresholds: targets and acceptable regions

#

Semantic threshold helpers select an axis without changing source observations.

Thresholds: targets and acceptable regions, colorset1
Renderer-derived tonescartesian
Options and implementation

The preferred response region is 2 to 4, the target is 6, and review occurs at input 8. The region uses a canonical neutral at 18% alpha to keep observations visible, producing derived composite pixels. Threshold helpers compile to ordinary axis rules and bands.

xy.chartxy.threshold_zonexy.thresholdxy.linexy.x_axisxy.y_axisxy.legendxy.theme

{
  "chart": [
    "title",
    "width",
    "height",
    "padding"
  ],
  "threshold_zone": [
    "start",
    "end",
    "axis",
    "text",
    "color",
    "opacity",
    "style"
  ],
  "threshold": [
    "value",
    "axis",
    "text",
    "color",
    "width",
    "opacity"
  ],
  "line": [
    "x",
    "y",
    "color",
    "width"
  ],
  "x_axis": [
    "label",
    "domain",
    "tick_count"
  ],
  "y_axis": [
    "label",
    "domain",
    "tick_count"
  ],
  "legend": [
    "show"
  ],
  "theme": [
    "palette"
  ]
}
Annotations · CS2

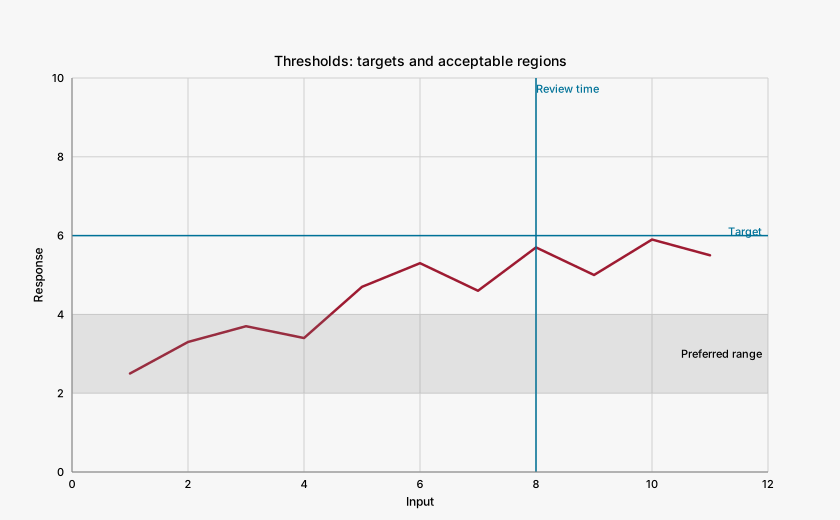
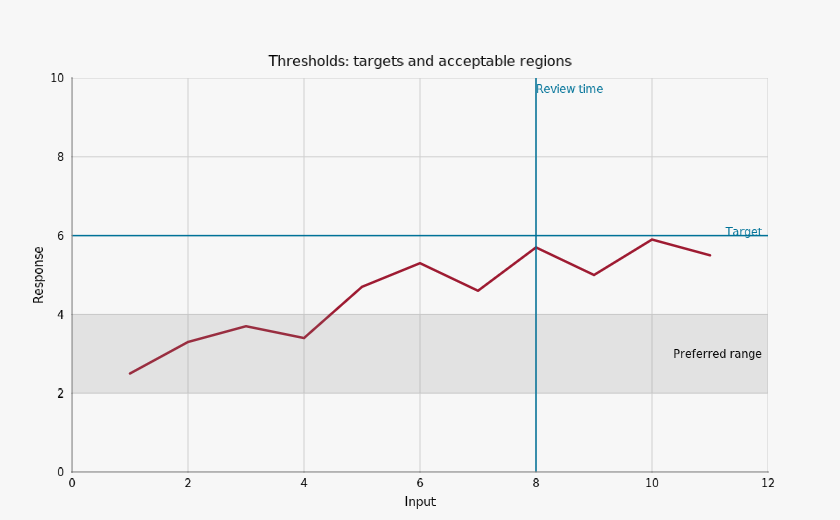
Thresholds: targets and acceptable regions

#

Semantic threshold helpers select an axis without changing source observations.

Thresholds: targets and acceptable regions, colorset2
Renderer-derived tonescartesian
Options and implementation

The preferred response region is 2 to 4, the target is 6, and review occurs at input 8. The region uses a canonical neutral at 18% alpha to keep observations visible, producing derived composite pixels. Threshold helpers compile to ordinary axis rules and bands.

xy.chartxy.threshold_zonexy.thresholdxy.linexy.x_axisxy.y_axisxy.legendxy.theme

{
  "chart": [
    "title",
    "width",
    "height",
    "padding"
  ],
  "threshold_zone": [
    "start",
    "end",
    "axis",
    "text",
    "color",
    "opacity",
    "style"
  ],
  "threshold": [
    "value",
    "axis",
    "text",
    "color",
    "width",
    "opacity"
  ],
  "line": [
    "x",
    "y",
    "color",
    "width"
  ],
  "x_axis": [
    "label",
    "domain",
    "tick_count"
  ],
  "y_axis": [
    "label",
    "domain",
    "tick_count"
  ],
  "legend": [
    "show"
  ],
  "theme": [
    "palette"
  ]
}

Axes and layout

Axes and layout · CS1

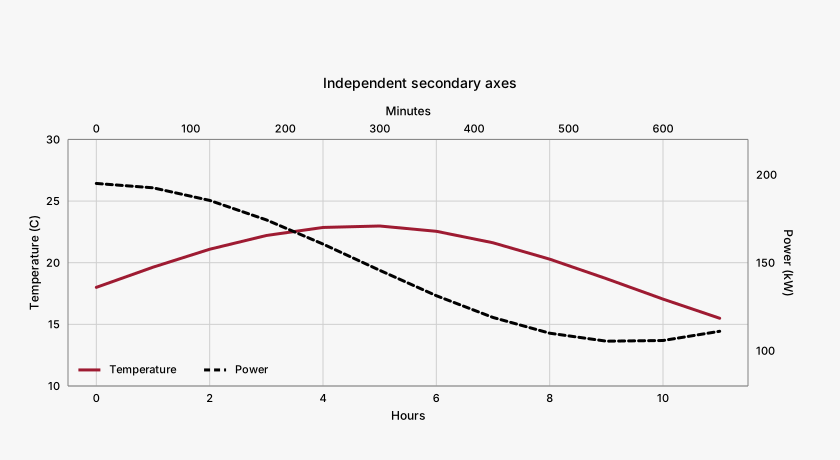
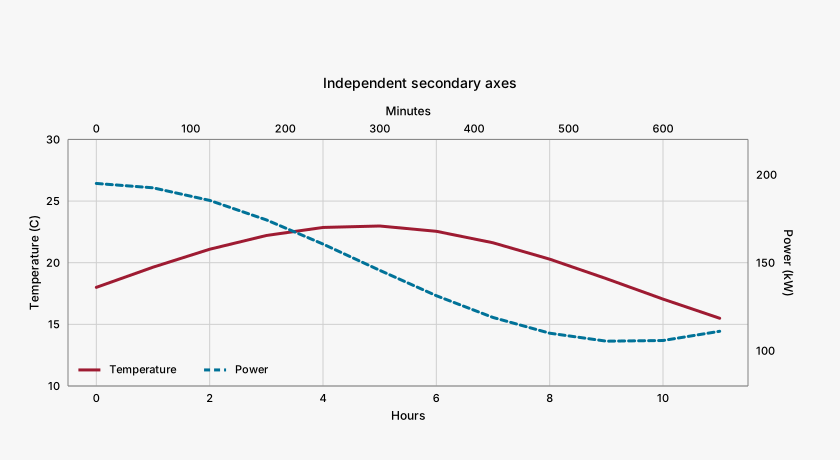
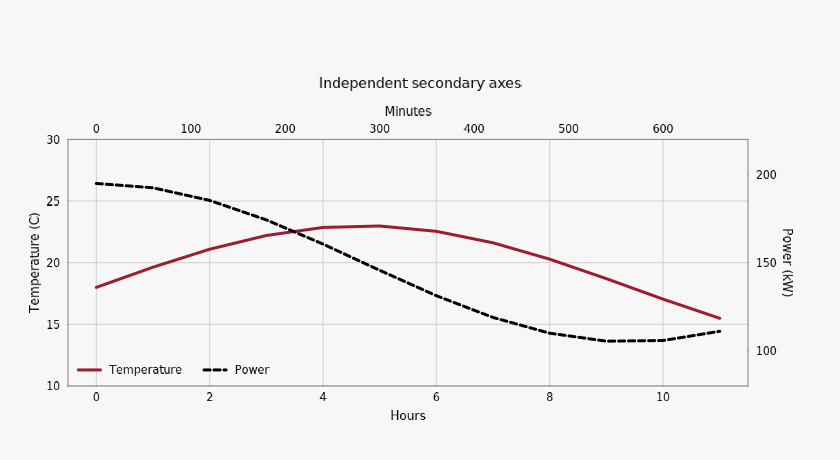
Independent secondary axes

#

Two signals bind to independent x/x2 and y/y2 axes.

Independent secondary axes, colorset1
Exact palette paintscartesian
Options and implementation

The upper axis uses minutes and the right axis uses kilowatts. The same screen position can have different coordinates on each named axis; zoom policies can address each ID independently.

xy.chartxy.linexy.x_axisxy.y_axis

{
  "chart": [
    "width",
    "height",
    "padding",
    "title"
  ],
  "line": [
    "x_axis",
    "y_axis",
    "dash"
  ],
  "x_axis": [
    "id",
    "label",
    "side",
    "domain"
  ],
  "y_axis": [
    "id",
    "label",
    "side",
    "domain"
  ]
}
Axes and layout · CS2

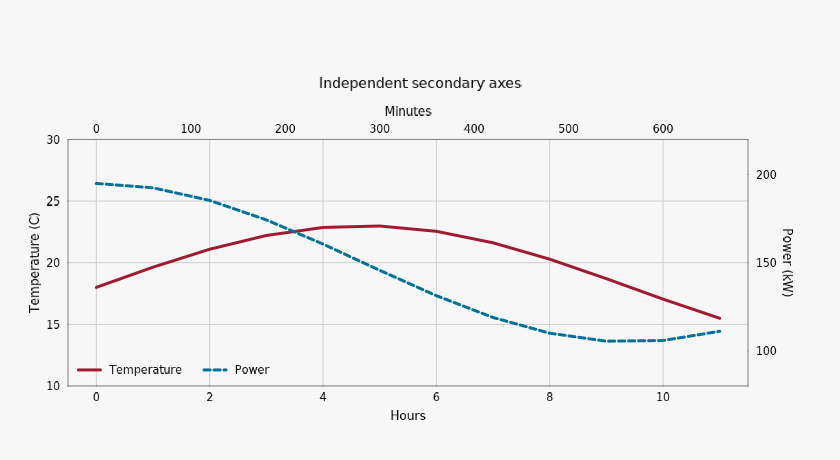
Independent secondary axes

#

Two signals bind to independent x/x2 and y/y2 axes.

Independent secondary axes, colorset2
Exact palette paintscartesian
Options and implementation

The upper axis uses minutes and the right axis uses kilowatts. The same screen position can have different coordinates on each named axis; zoom policies can address each ID independently.

xy.chartxy.linexy.x_axisxy.y_axis

{
  "chart": [
    "width",
    "height",
    "padding",
    "title"
  ],
  "line": [
    "x_axis",
    "y_axis",
    "dash"
  ],
  "x_axis": [
    "id",
    "label",
    "side",
    "domain"
  ],
  "y_axis": [
    "id",
    "label",
    "side",
    "domain"
  ]
}
Axes and layout · CS1

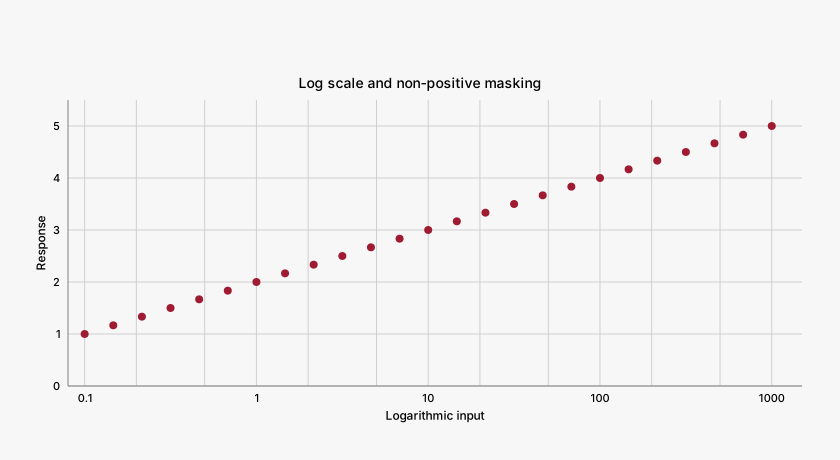
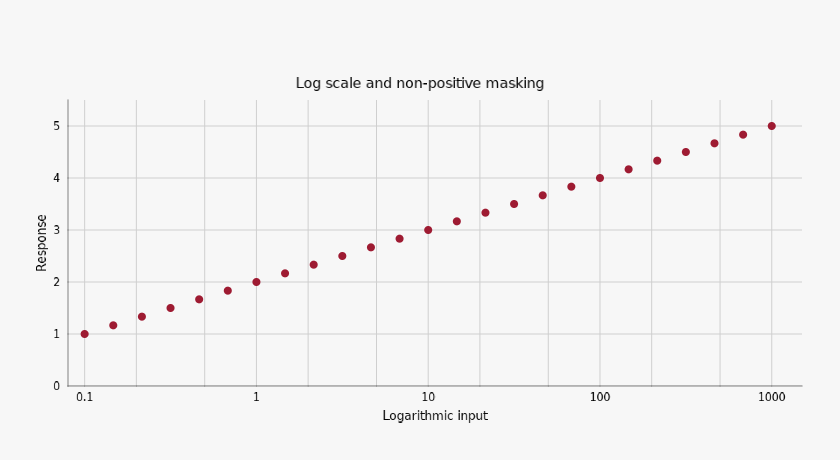
Log scale and non-positive masking

#

Equal ratios occupy equal horizontal distances; zero and negative inputs are masked.

Log scale and non-positive masking, colorset1
Exact palette paintscartesian
Options and implementation

The source retains two non-positive inputs. The explicit log-axis policy masks them rather than pretending they have valid logarithmic positions.

xy.x_axis

{
  "x_axis": [
    "type_",
    "nonpositive",
    "domain",
    "label"
  ]
}
Axes and layout · CS2

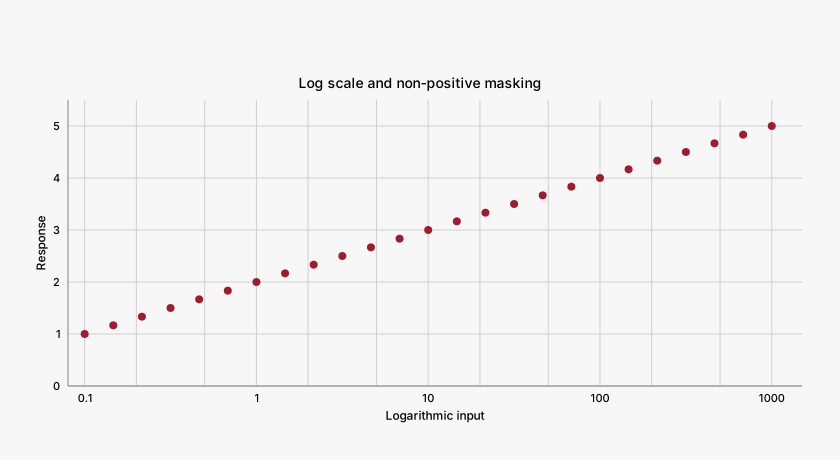
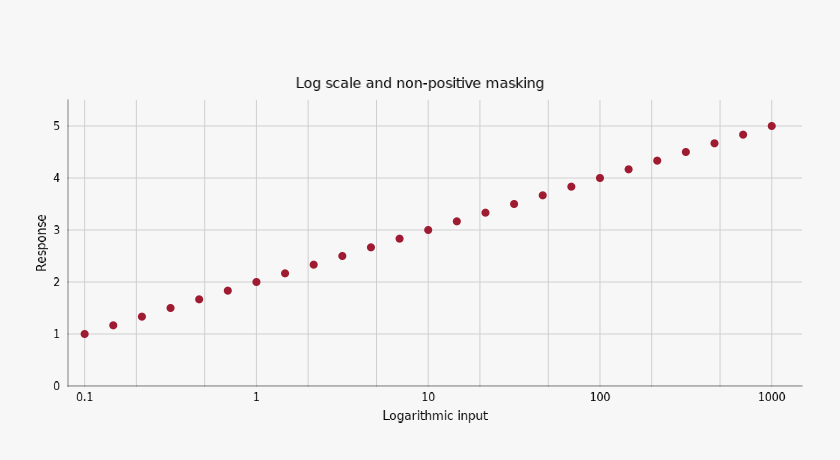
Log scale and non-positive masking

#

Equal ratios occupy equal horizontal distances; zero and negative inputs are masked.

Log scale and non-positive masking, colorset2
Exact palette paintscartesian
Options and implementation

The source retains two non-positive inputs. The explicit log-axis policy masks them rather than pretending they have valid logarithmic positions.

xy.x_axis

{
  "x_axis": [
    "type_",
    "nonpositive",
    "domain",
    "label"
  ]
}
Axes and layout · CS1

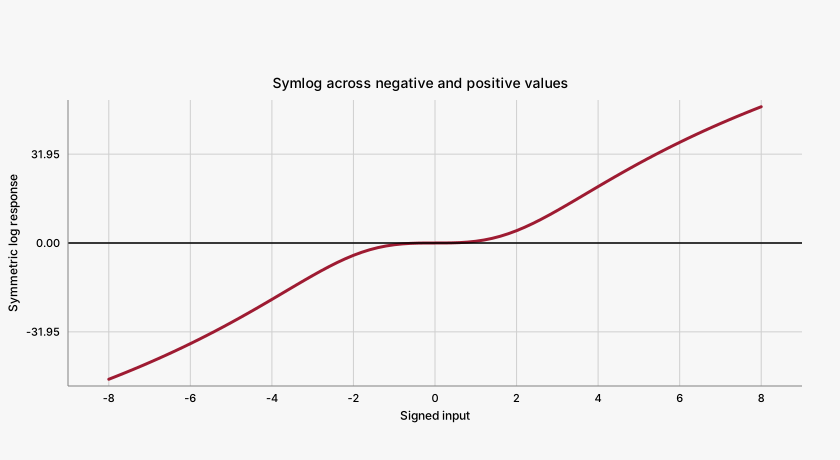
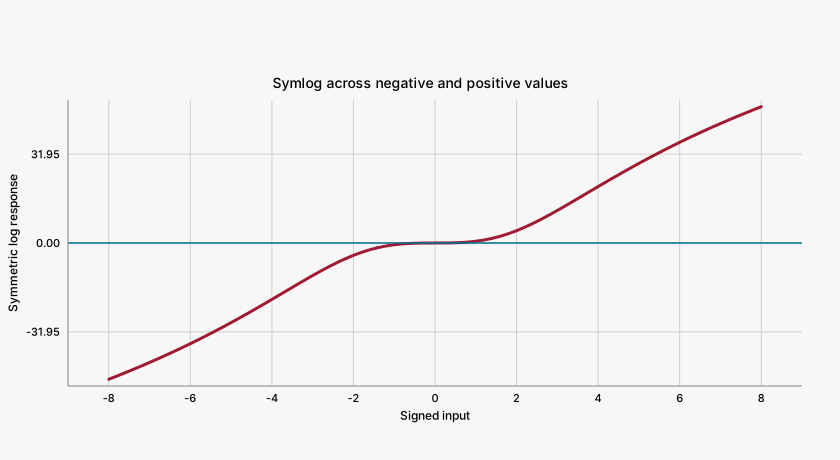
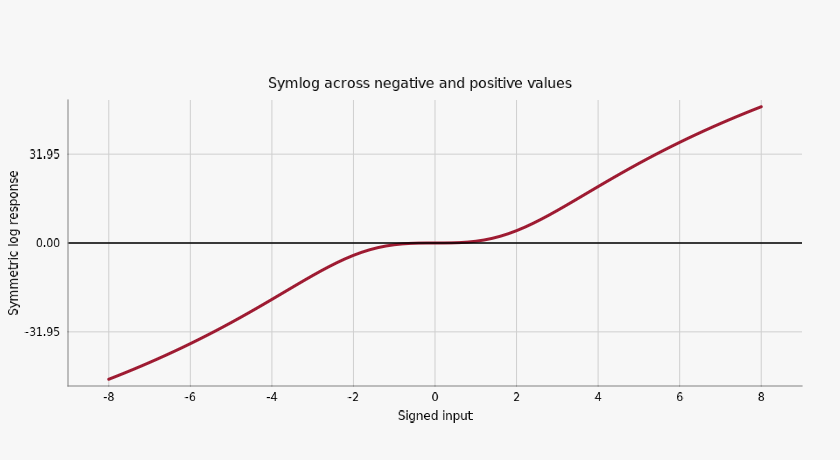
Symlog across negative and positive values

#

A linear neighborhood around zero connects logarithmic positive and negative tails.

Symlog across negative and positive values, colorset1
Exact palette paintscartesian
Options and implementation

The constant of 5 defines the linear central region. Signed observations remain on their original side of zero.

xy.y_axisxy.hline

{
  "y_axis": [
    "type_",
    "constant",
    "domain",
    "label"
  ],
  "hline": [
    "color"
  ]
}
Axes and layout · CS2

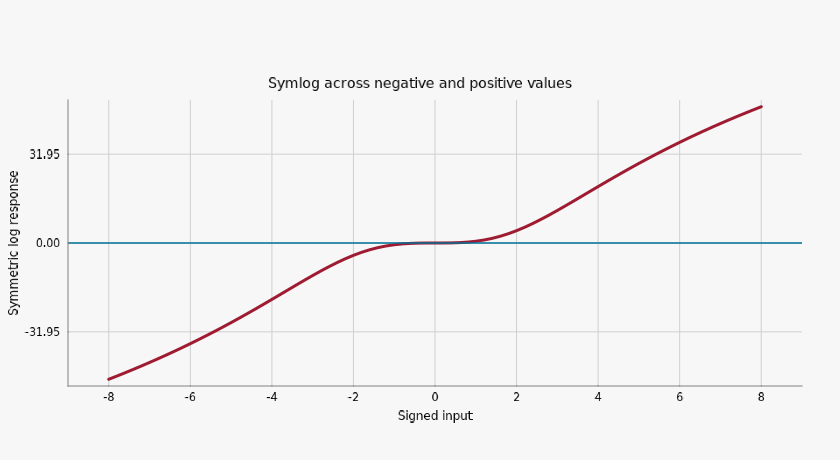
Symlog across negative and positive values

#

A linear neighborhood around zero connects logarithmic positive and negative tails.

Symlog across negative and positive values, colorset2
Exact palette paintscartesian
Options and implementation

The constant of 5 defines the linear central region. Signed observations remain on their original side of zero.

xy.y_axisxy.hline

{
  "y_axis": [
    "type_",
    "constant",
    "domain",
    "label"
  ],
  "hline": [
    "color"
  ]
}
Axes and layout · CS1

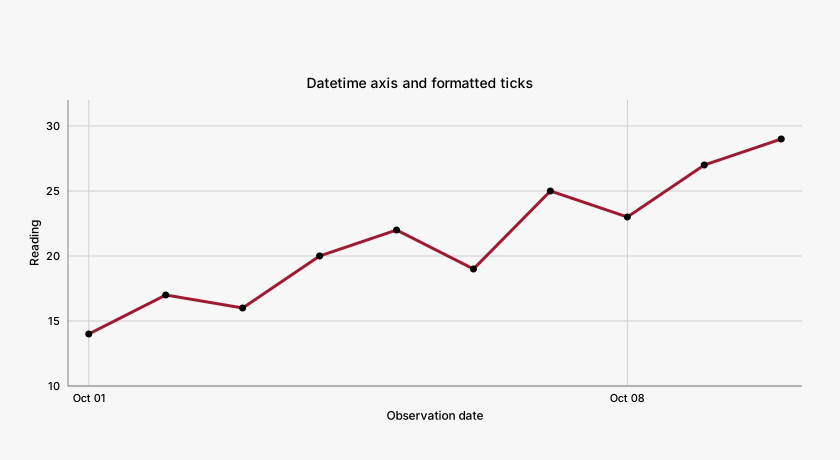
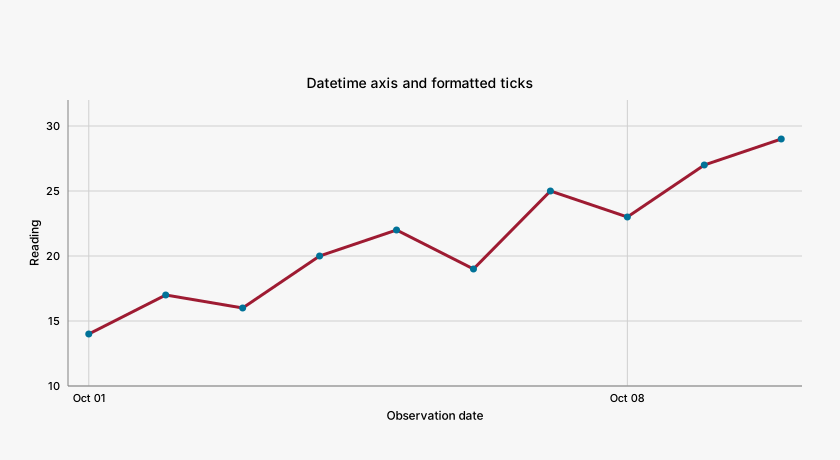
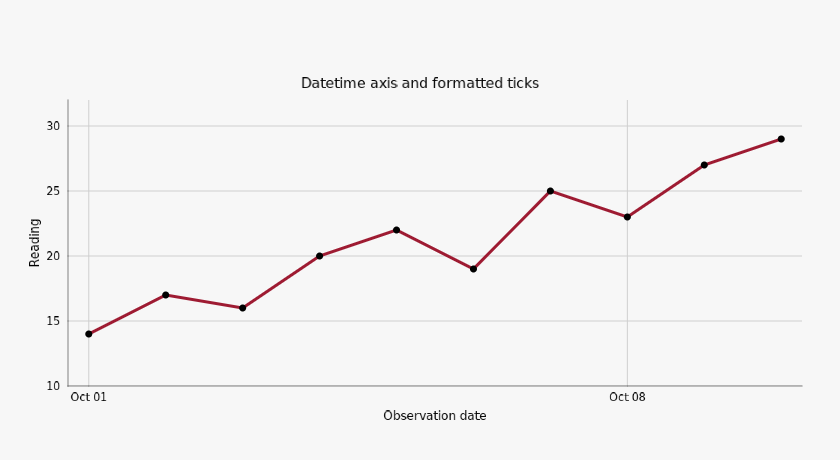
Datetime axis and formatted ticks

#

Real datetime64 observations use a time axis rather than a categorical string axis.

Datetime axis and formatted ticks, colorset1
Exact palette paintscartesian
Options and implementation

XY canonical time is milliseconds. This daily example does not claim preservation of sub-millisecond distinctions or a live calendar connection.

xy.x_axis

{
  "x_axis": [
    "type_",
    "format",
    "tick_count",
    "label"
  ]
}
Axes and layout · CS2

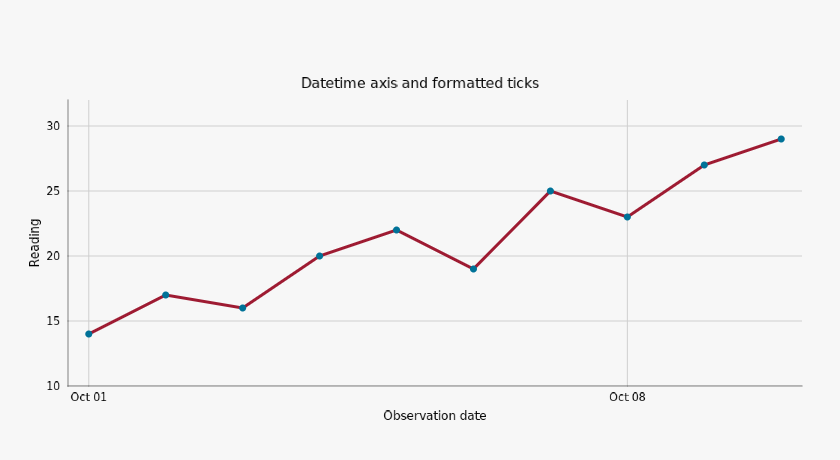
Datetime axis and formatted ticks

#

Real datetime64 observations use a time axis rather than a categorical string axis.

Datetime axis and formatted ticks, colorset2
Exact palette paintscartesian
Options and implementation

XY canonical time is milliseconds. This daily example does not claim preservation of sub-millisecond distinctions or a live calendar connection.

xy.x_axis

{
  "x_axis": [
    "type_",
    "format",
    "tick_count",
    "label"
  ]
}
Axes and layout · CS1

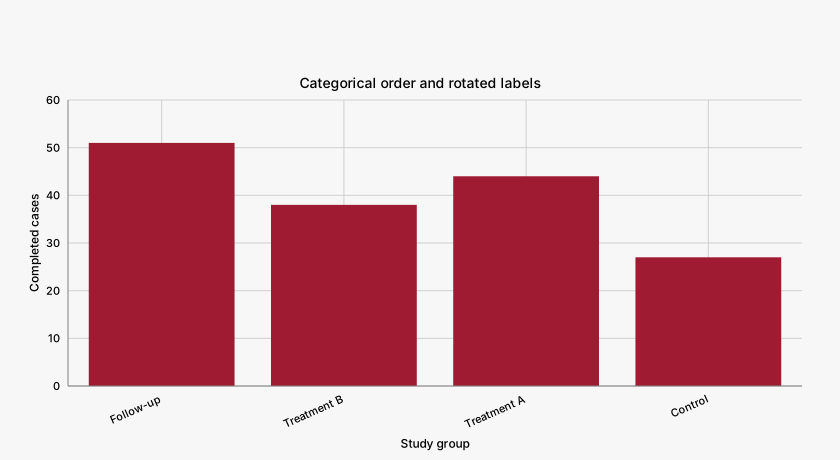
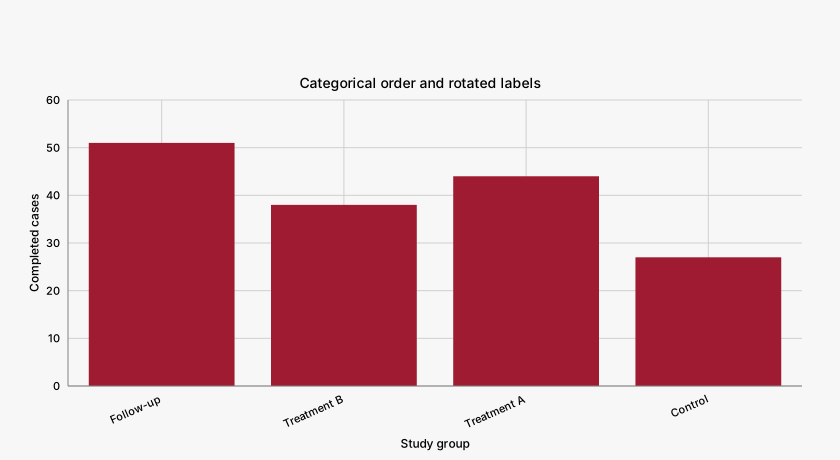
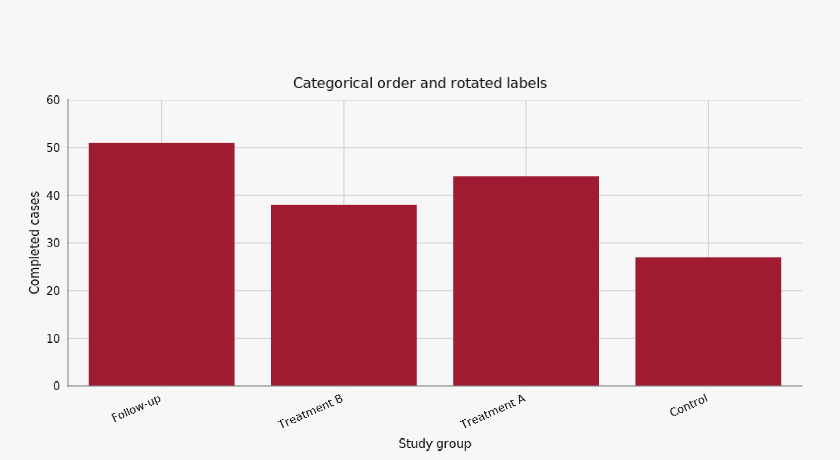
Categorical order and rotated labels

#

String categories retain identity while the explicit axis reverses display order.

Categorical order and rotated labels, colorset1
Exact palette paintscartesian
Options and implementation

Rotation and end anchoring help long labels fit. Reversal changes the axis orientation rather than sorting or modifying the underlying categories.

xy.x_axis

{
  "x_axis": [
    "label",
    "label_offset",
    "reverse",
    "tick_label_angle",
    "tick_label_anchor",
    "tick_label_strategy"
  ]
}
Axes and layout · CS2

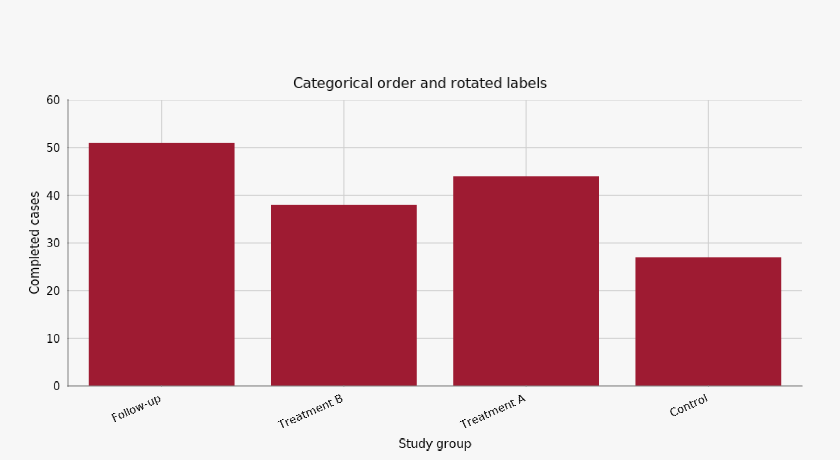
Categorical order and rotated labels

#

String categories retain identity while the explicit axis reverses display order.

Categorical order and rotated labels, colorset2
Exact palette paintscartesian
Options and implementation

Rotation and end anchoring help long labels fit. Reversal changes the axis orientation rather than sorting or modifying the underlying categories.

xy.x_axis

{
  "x_axis": [
    "label",
    "label_offset",
    "reverse",
    "tick_label_angle",
    "tick_label_anchor",
    "tick_label_strategy"
  ]
}
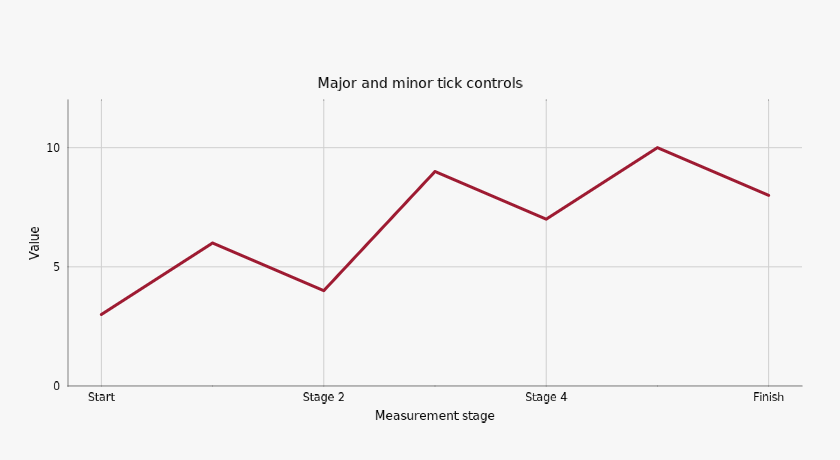
Axes and layout · CS1

Major and minor tick controls

#

Named major ticks coexist with unlabeled minor ticks and mirrored tick marks.

Major and minor tick controls, colorset1
Exact palette paintscartesian
Options and implementation

The top edge repeats tick marks without repeating labels. Axis visibility switches independently control baselines, ticks, grids, and text.

xy.x_axisxy.y_axis

{
  "x_axis": [
    "tick_values",
    "minor_tick_values",
    "tick_labels",
    "tick_sides",
    "tick_label_sides",
    "show",
    "line",
    "ticks",
    "grid",
    "text"
  ],
  "y_axis": [
    "tick_count",
    "format"
  ]
}
Axes and layout · CS2

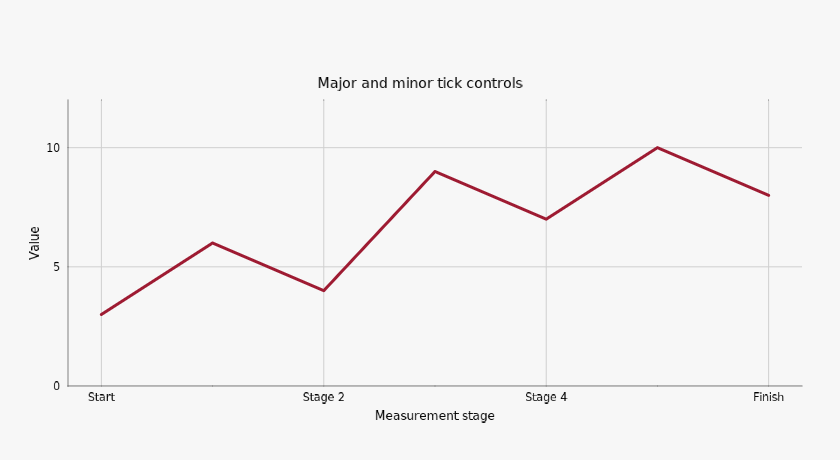
Major and minor tick controls

#

Named major ticks coexist with unlabeled minor ticks and mirrored tick marks.

Major and minor tick controls, colorset2
Exact palette paintscartesian
Options and implementation

The top edge repeats tick marks without repeating labels. Axis visibility switches independently control baselines, ticks, grids, and text.

xy.x_axisxy.y_axis

{
  "x_axis": [
    "tick_values",
    "minor_tick_values",
    "tick_labels",
    "tick_sides",
    "tick_label_sides",
    "show",
    "line",
    "ticks",
    "grid",
    "text"
  ],
  "y_axis": [
    "tick_count",
    "format"
  ]
}
Axes and layout · CS1

Linked facet panels

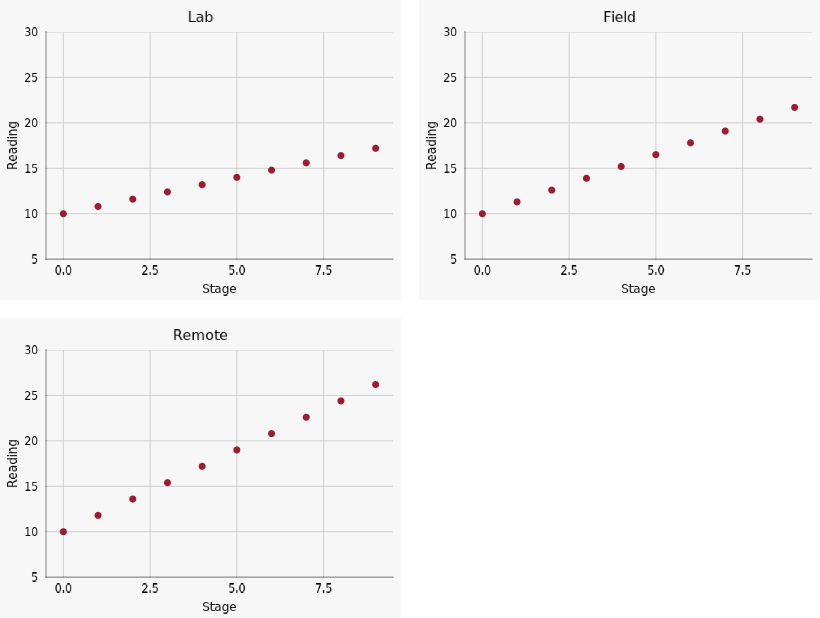
#

Three group panels share domains and synchronize their x views within one document.

Linked facet panels, colorset1
Exact palette paintsfacet
Options and implementation

Zoom a panel to verify linked x ranges. Linked selections echo data-space geometry rather than cross-filtering source rows. XY 0.0.8 facets require integer dimensions and fixed panel widths; narrow screens can scroll within the fixed grid. Separate HTML documents do not share the link. XY 0.0.8 facets use integer grid dimensions; the standalone grid scrolls horizontally on narrow screens instead of shrinking fixed-width child panels. Native SVG and PNG compose the facet heading differently; the manifest records each format's actual dimensions.

xy.facet_chartxy.interaction_config

{
  "facet_chart": [
    "data",
    "by",
    "cols",
    "share_x",
    "share_y",
    "link",
    "link_select",
    "gap",
    "width",
    "height"
  ],
  "interaction_config": [
    "select",
    "brush",
    "crosshair"
  ]
}
Axes and layout · CS2

Linked facet panels

#

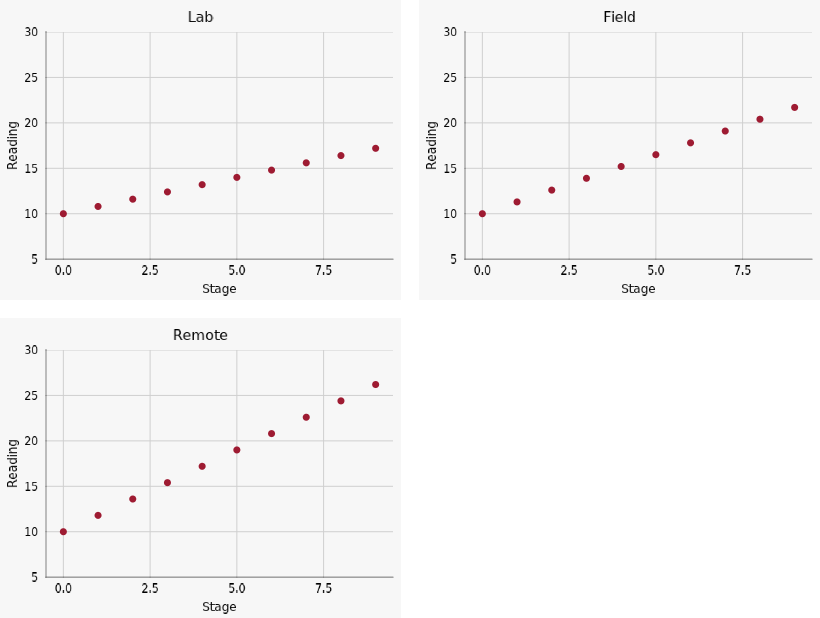
Three group panels share domains and synchronize their x views within one document.

Linked facet panels, colorset2
Exact palette paintsfacet
Options and implementation

Zoom a panel to verify linked x ranges. Linked selections echo data-space geometry rather than cross-filtering source rows. XY 0.0.8 facets require integer dimensions and fixed panel widths; narrow screens can scroll within the fixed grid. Separate HTML documents do not share the link. XY 0.0.8 facets use integer grid dimensions; the standalone grid scrolls horizontally on narrow screens instead of shrinking fixed-width child panels. Native SVG and PNG compose the facet heading differently; the manifest records each format's actual dimensions.

xy.facet_chartxy.interaction_config

{
  "facet_chart": [
    "data",
    "by",
    "cols",
    "share_x",
    "share_y",
    "link",
    "link_select",
    "gap",
    "width",
    "height"
  ],
  "interaction_config": [
    "select",
    "brush",
    "crosshair"
  ]
}

Interaction and data

Interaction and data · CS1

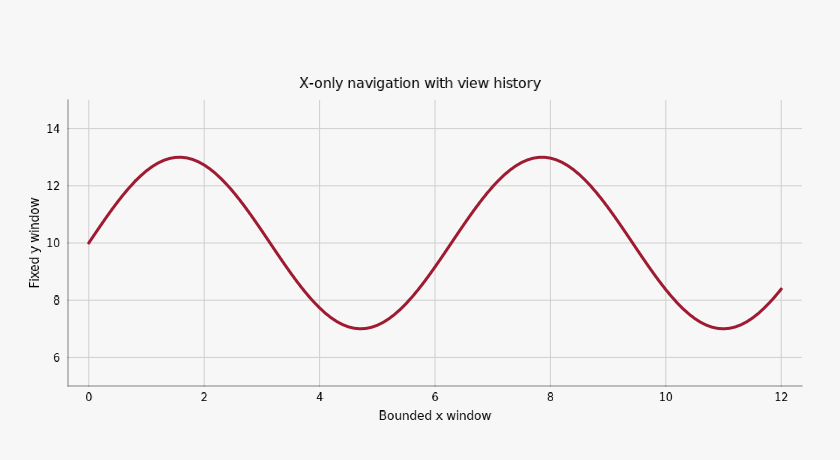
X-only navigation with view history

#

Pan and zoom x while y remains fixed; use history and reset controls.

X-only navigation with view history, colorset1
Exact palette paintscartesian
Options and implementation

The data bounds clamp x navigation and the magnification is limited to 1–8 times the home range. Back/forward and reset are browser-local view actions.

xy.interaction_configxy.x_axis

{
  "interaction_config": [
    "pan",
    "pan_axes",
    "zoom",
    "zoom_axes",
    "zoom_limits",
    "wheel_zoom",
    "box_zoom",
    "zoom_buttons",
    "double_click_reset",
    "reset_axes",
    "default_drag_action",
    "history"
  ],
  "x_axis": [
    "bounds"
  ]
}
Interaction and data · CS2

X-only navigation with view history

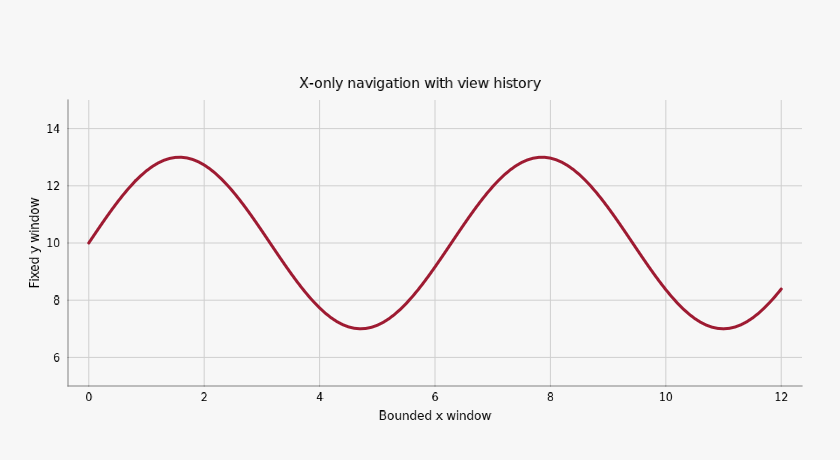
#

Pan and zoom x while y remains fixed; use history and reset controls.

X-only navigation with view history, colorset2
Exact palette paintscartesian
Options and implementation

The data bounds clamp x navigation and the magnification is limited to 1–8 times the home range. Back/forward and reset are browser-local view actions.

xy.interaction_configxy.x_axis

{
  "interaction_config": [
    "pan",
    "pan_axes",
    "zoom",
    "zoom_axes",
    "zoom_limits",
    "wheel_zoom",
    "box_zoom",
    "zoom_buttons",
    "double_click_reset",
    "reset_axes",
    "default_drag_action",
    "history"
  ],
  "x_axis": [
    "bounds"
  ]
}
Interaction and data · CS1

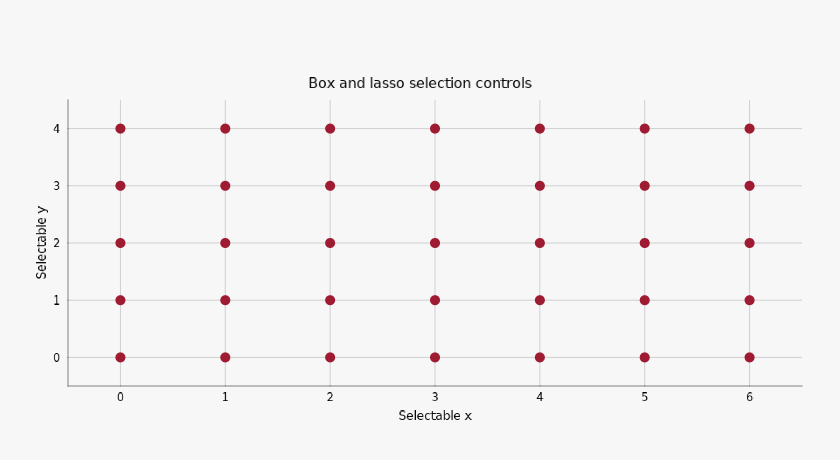
Box and lasso selection controls

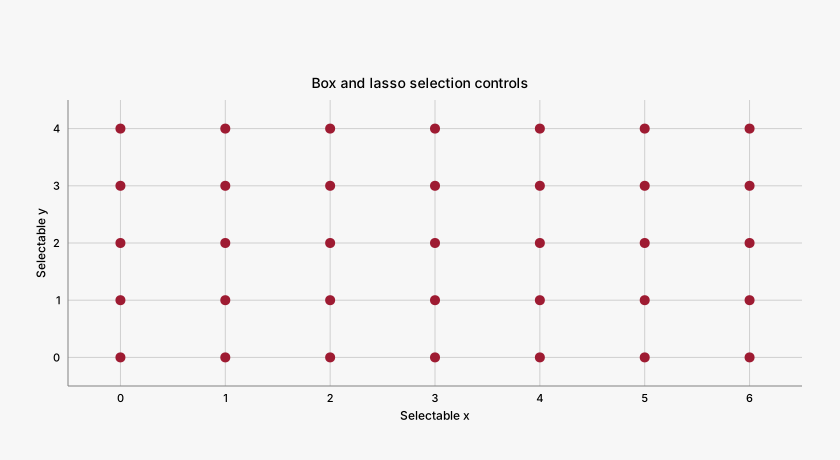
#

Start with lasso selection; switch drag mode to box, x range, or y range.

Box and lasso selection controls, colorset1
Exact palette paintscartesian
Options and implementation

Selection and hover are client-local in this HTML snapshot. Python callbacks and complete canonical row resolution require the notebook or Reflex host source.

xy.interaction_configxy.tooltip

{
  "interaction_config": [
    "hover",
    "click",
    "select",
    "brush",
    "crosshair",
    "default_drag_action"
  ],
  "tooltip": [
    "fields",
    "labels",
    "format",
    "title"
  ]
}
Interaction and data · CS2

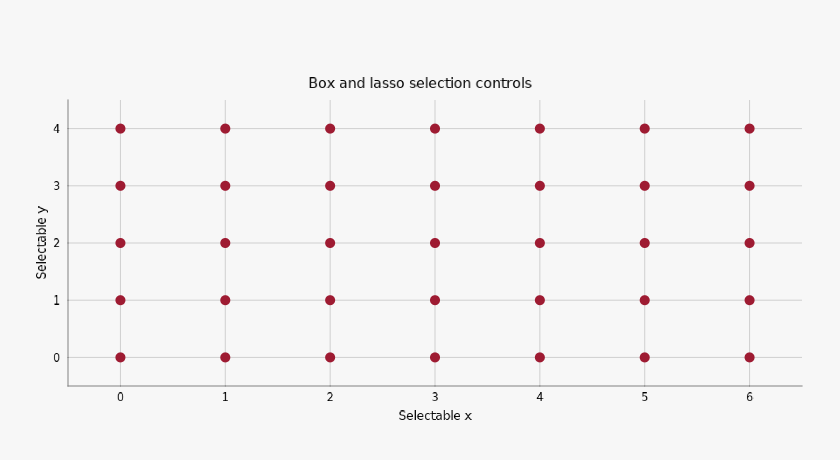
Box and lasso selection controls

#

Start with lasso selection; switch drag mode to box, x range, or y range.

Box and lasso selection controls, colorset2
Exact palette paintscartesian
Options and implementation

Selection and hover are client-local in this HTML snapshot. Python callbacks and complete canonical row resolution require the notebook or Reflex host source.

xy.interaction_configxy.tooltip

{
  "interaction_config": [
    "hover",
    "click",
    "select",
    "brush",
    "crosshair",
    "default_drag_action"
  ],
  "tooltip": [
    "fields",
    "labels",
    "format",
    "title"
  ]
}
Interaction and data · CS1

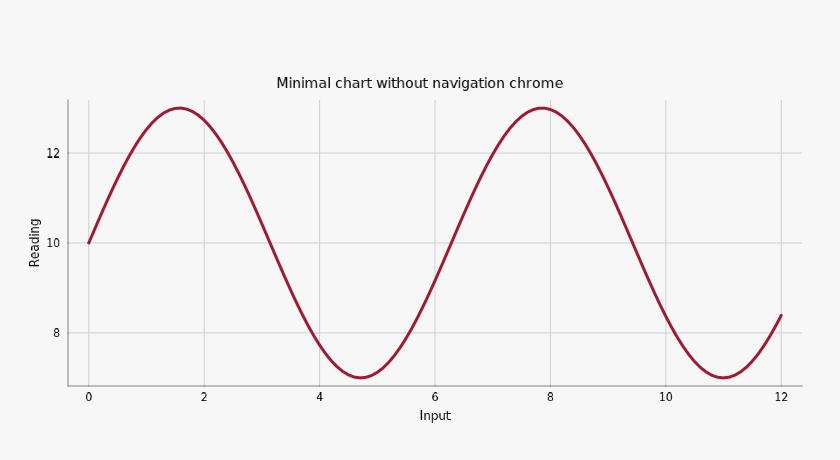
Minimal chart without navigation chrome

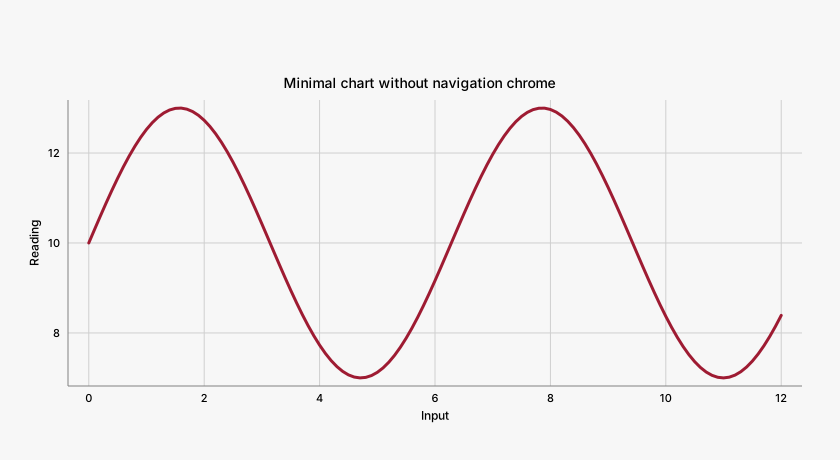
#

A compact reporting view deliberately disables toolbar, hover, selection, and navigation.

Minimal chart without navigation chrome, colorset1
Exact palette paintsnone
Options and implementation

The export remains a browser-rendered XY chart, with all interaction switches explicitly disabled. The absence of controls is the feature being demonstrated.

xy.modebarxy.tooltipxy.interaction_config

{
  "modebar": [
    "show"
  ],
  "tooltip": [
    "show"
  ],
  "interaction_config": [
    "hover",
    "click",
    "select",
    "brush",
    "crosshair",
    "navigation",
    "history"
  ]
}
Interaction and data · CS2

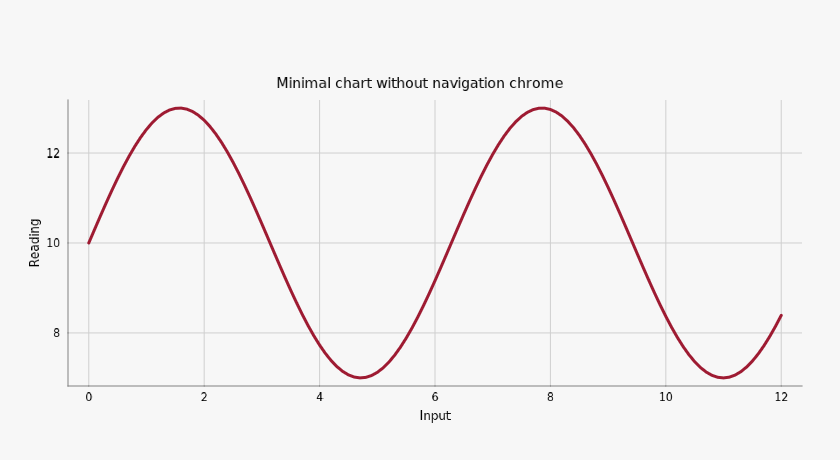
Minimal chart without navigation chrome

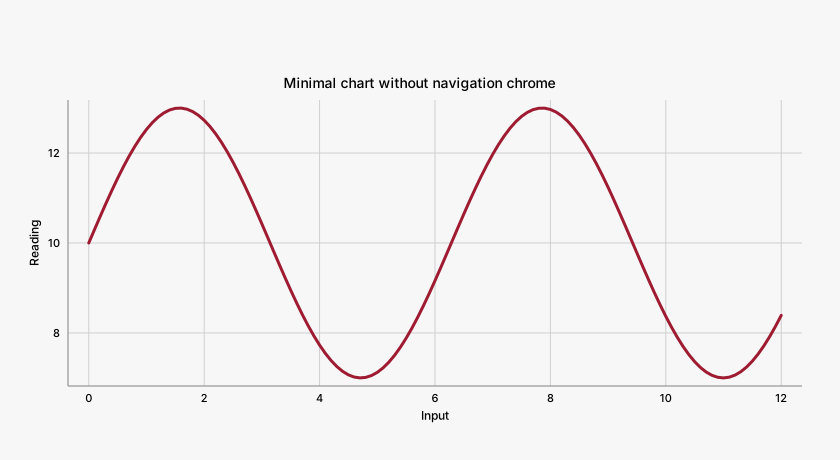
#

A compact reporting view deliberately disables toolbar, hover, selection, and navigation.

Minimal chart without navigation chrome, colorset2
Exact palette paintsnone
Options and implementation

The export remains a browser-rendered XY chart, with all interaction switches explicitly disabled. The absence of controls is the feature being demonstrated.

xy.modebarxy.tooltipxy.interaction_config

{
  "modebar": [
    "show"
  ],
  "tooltip": [
    "show"
  ],
  "interaction_config": [
    "hover",
    "click",
    "select",
    "brush",
    "crosshair",
    "navigation",
    "history"
  ]
}
Interaction and data · CS1

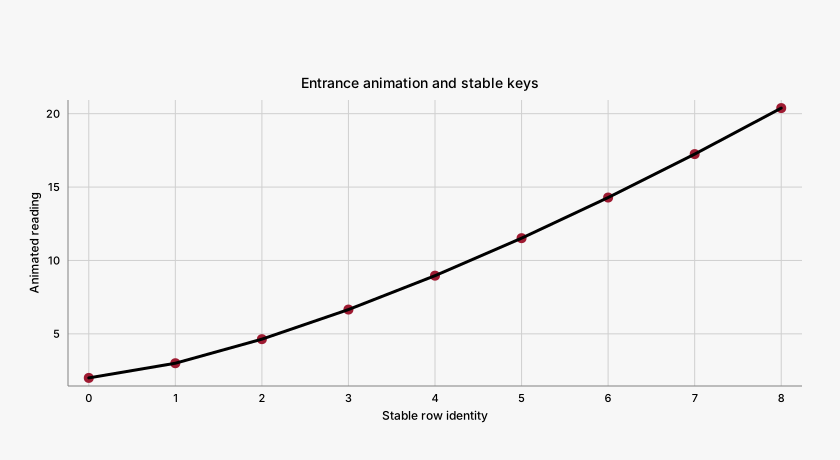
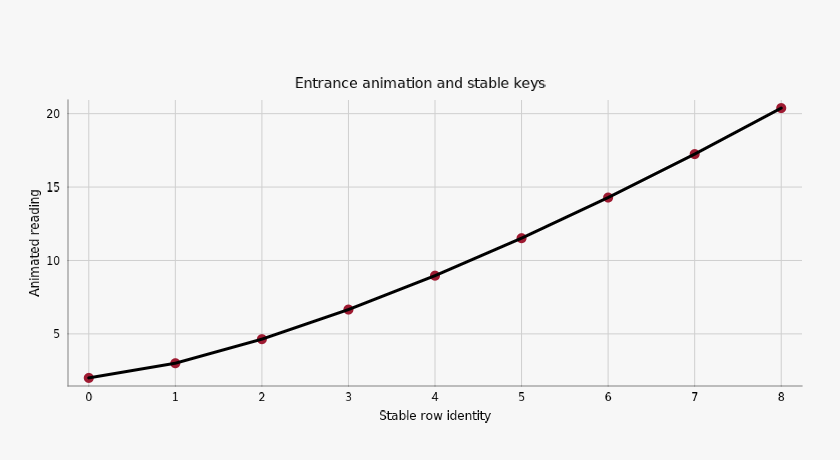
Entrance animation and stable keys

#

A spring-based point entrance and a mark-level line reveal share stable row identities.

Entrance animation and stable keys, colorset1
Renderer-derived tonescartesian
Options and implementation

Reload the interactive export to replay entrance motion. Native images show the deterministic final scene. Subsequent data-update animation needs a live host; intermediate pixels can be renderer-derived blends.

xy.animationxy.springxy.scatterxy.line

{
  "animation": [
    "enabled",
    "duration",
    "easing",
    "match",
    "enter",
    "update",
    "interpolate"
  ],
  "spring": [
    "stiffness",
    "damping",
    "mass"
  ],
  "scatter": [
    "key"
  ],
  "line": [
    "key",
    "animation"
  ]
}
Interaction and data · CS2

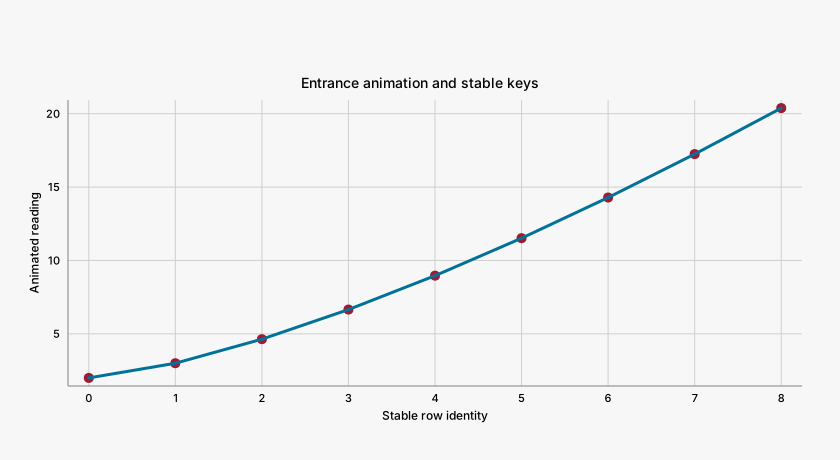
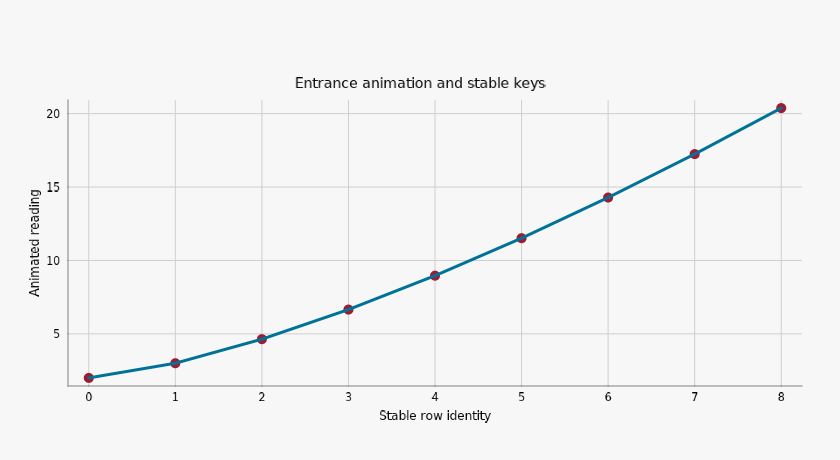
Entrance animation and stable keys

#

A spring-based point entrance and a mark-level line reveal share stable row identities.

Entrance animation and stable keys, colorset2
Renderer-derived tonescartesian
Options and implementation

Reload the interactive export to replay entrance motion. Native images show the deterministic final scene. Subsequent data-update animation needs a live host; intermediate pixels can be renderer-derived blends.

xy.animationxy.springxy.scatterxy.line

{
  "animation": [
    "enabled",
    "duration",
    "easing",
    "match",
    "enter",
    "update",
    "interpolate"
  ],
  "spring": [
    "stiffness",
    "damping",
    "mass"
  ],
  "scatter": [
    "key"
  ],
  "line": [
    "key",
    "animation"
  ]
}
Interaction and data · CS1

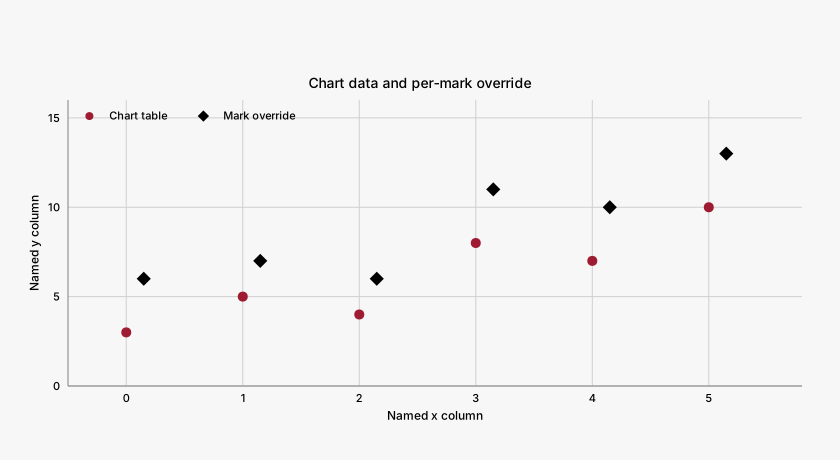
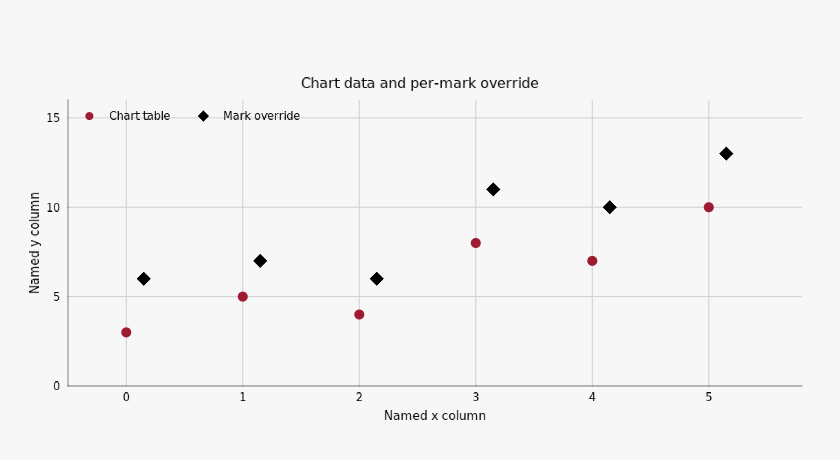
Chart data and per-mark override

#

One mark resolves named columns from chart data; a second explicitly overrides its table.

Chart data and per-mark override, colorset1
Exact palette paintscartesian
Options and implementation

Both marks use the same column names but preserve different arrays. The override applies to that mark only; it does not mutate the chart-level table.

xy.chartxy.scatterxy.tooltip

{
  "chart": [
    "data"
  ],
  "scatter": [
    "x",
    "y",
    "data",
    "symbol"
  ],
  "tooltip": [
    "fields",
    "labels"
  ]
}
Interaction and data · CS2

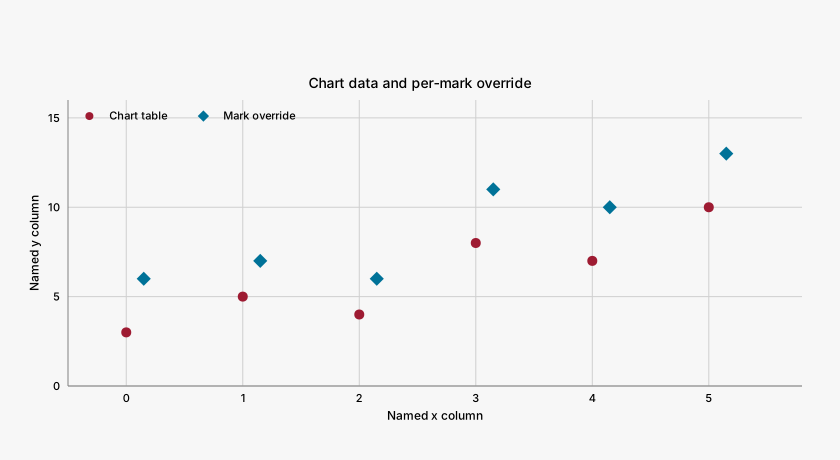
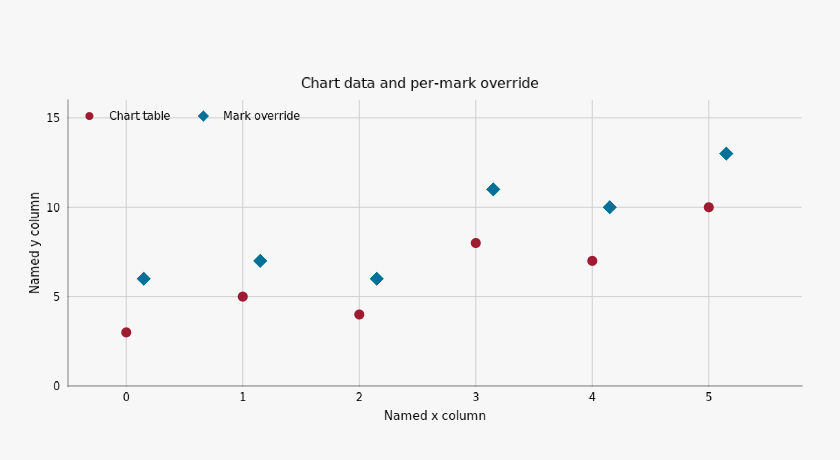
Chart data and per-mark override

#

One mark resolves named columns from chart data; a second explicitly overrides its table.

Chart data and per-mark override, colorset2
Exact palette paintscartesian
Options and implementation

Both marks use the same column names but preserve different arrays. The override applies to that mark only; it does not mutate the chart-level table.

xy.chartxy.scatterxy.tooltip

{
  "chart": [
    "data"
  ],
  "scatter": [
    "x",
    "y",
    "data",
    "symbol"
  ],
  "tooltip": [
    "fields",
    "labels"
  ]
}
Styling and extensions

Styling and extensions · CS1

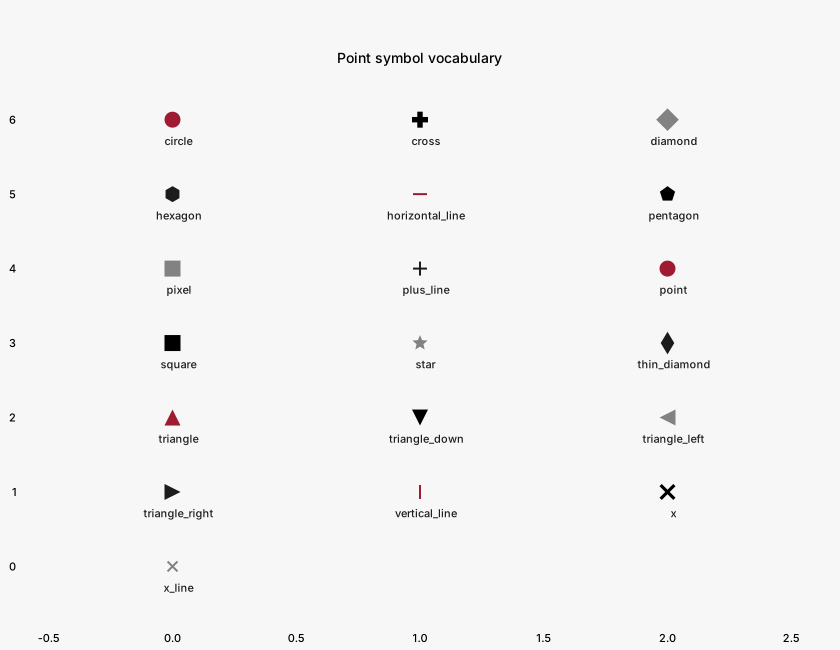
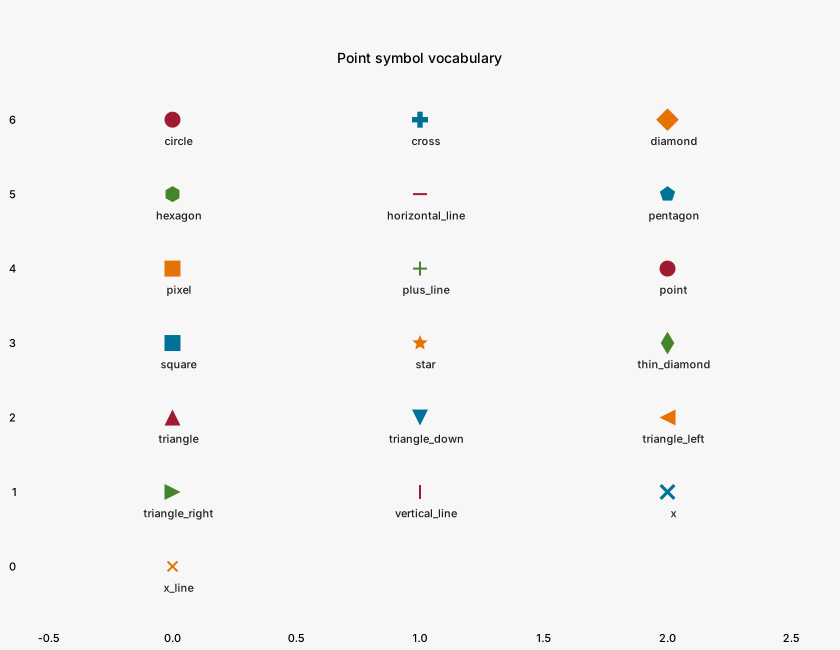
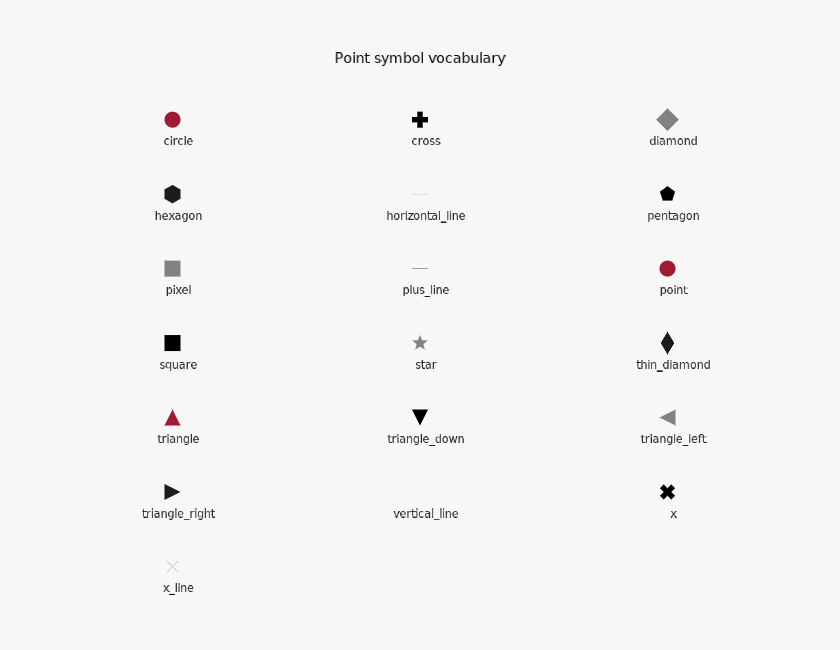
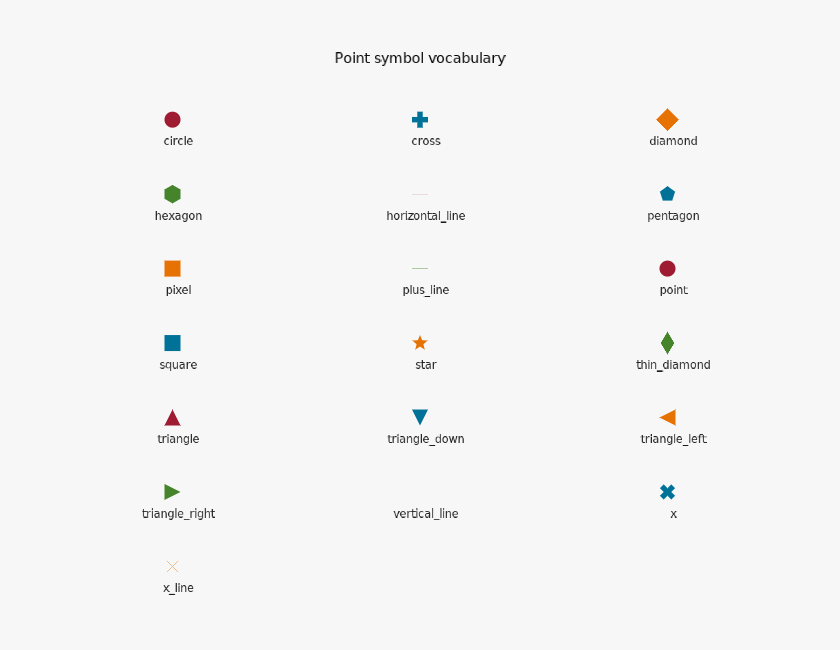
Every point symbol

#

All 19 shipped point symbols, at a common marker size.

Every point symbol, colorset1
Exact palette paintscartesianSVG compatibility repair
Options and implementation

Names match the installed validator and use the same requested marker size. Some names are aliases. The four line-only glyphs use an explicit two-pixel stroke so they remain visible; filled glyphs have no decorative outline. Shape can carry category identity alongside either palette. The native line-only glyph SVG has a known duplicate-fill defect in 0.0.8. The builder preserves its original text and applies the bundled narrow XML compatibility repair without changing stroke or geometry.

xy.scatterxy.scatter_chartxy.textxy.x_axisxy.y_axisxy.theme

{
  "scatter": [
    "symbol",
    "size",
    "color",
    "opacity",
    "density",
    "stroke",
    "stroke_width"
  ],
  "text": [
    "anchor",
    "color",
    "style"
  ]
}
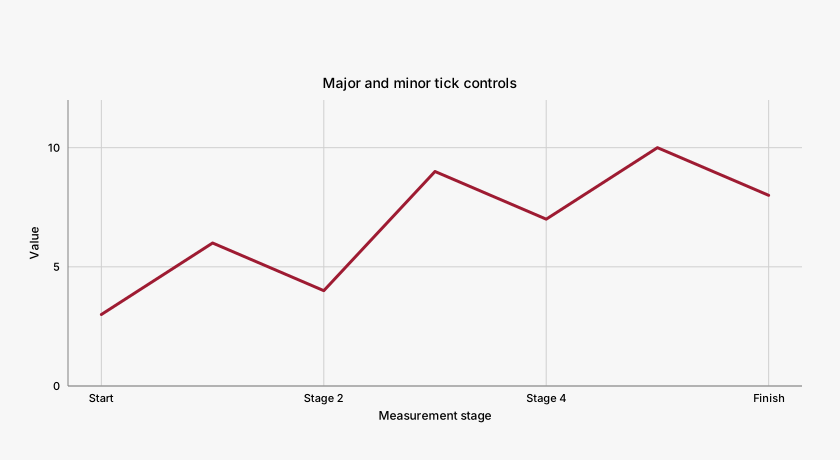
Styling and extensions · CS2

Every point symbol

#

All 19 shipped point symbols, at a common marker size.

Every point symbol, colorset2
Exact palette paintscartesianSVG compatibility repair
Options and implementation

Names match the installed validator and use the same requested marker size. Some names are aliases. The four line-only glyphs use an explicit two-pixel stroke so they remain visible; filled glyphs have no decorative outline. Shape can carry category identity alongside either palette. The native line-only glyph SVG has a known duplicate-fill defect in 0.0.8. The builder preserves its original text and applies the bundled narrow XML compatibility repair without changing stroke or geometry.

xy.scatterxy.scatter_chartxy.textxy.x_axisxy.y_axisxy.theme

{
  "scatter": [
    "symbol",
    "size",
    "color",
    "opacity",
    "density",
    "stroke",
    "stroke_width"
  ],
  "text": [
    "anchor",
    "color",
    "style"
  ]
}
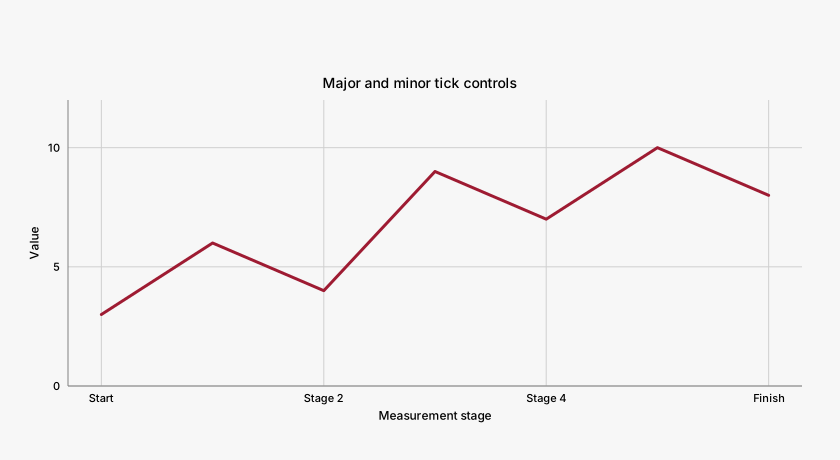
Styling and extensions · CS1

Dash patterns and curve interpolation

#

Four named dash presets, one custom dash array, and a smooth curve.

Dash patterns and curve interpolation, colorset1
Exact palette paintscartesian
Options and implementation

Dash length is a visual encoding independent of color. The upper series uses a documented smooth curve; the others preserve linear segments. The guide does not imply identical wide-line joins across every renderer.

xy.linexy.line_chartxy.legendxy.theme

{
  "line": [
    "dash",
    "curve",
    "width",
    "color",
    "name"
  ],
  "legend": [
    "ncols",
    "loc",
    "style"
  ]
}
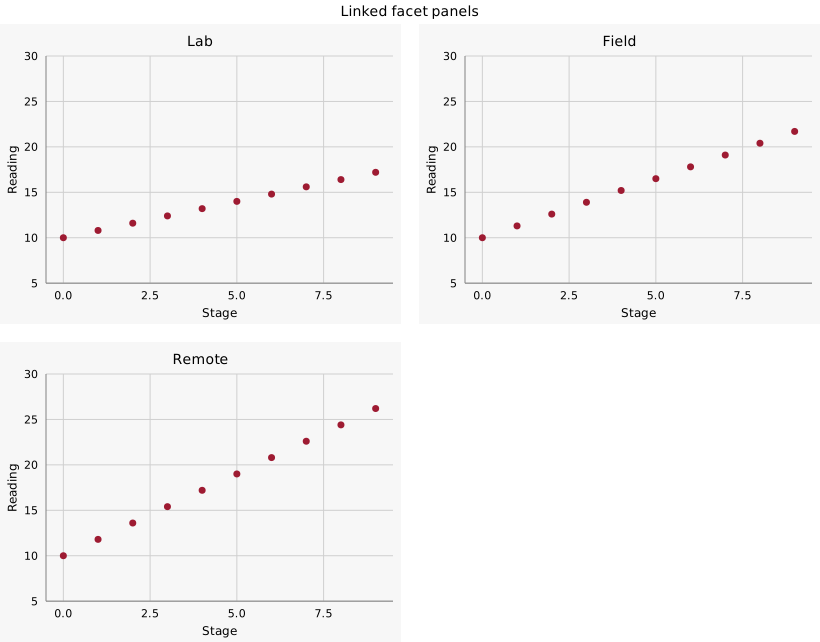
Styling and extensions · CS2

Dash patterns and curve interpolation

#

Four named dash presets, one custom dash array, and a smooth curve.

Dash patterns and curve interpolation, colorset2
Exact palette paintscartesian
Options and implementation

Dash length is a visual encoding independent of color. The upper series uses a documented smooth curve; the others preserve linear segments. The guide does not imply identical wide-line joins across every renderer.

xy.linexy.line_chartxy.legendxy.theme

{
  "line": [
    "dash",
    "curve",
    "width",
    "color",
    "name"
  ],
  "legend": [
    "ncols",
    "loc",
    "style"
  ]
}
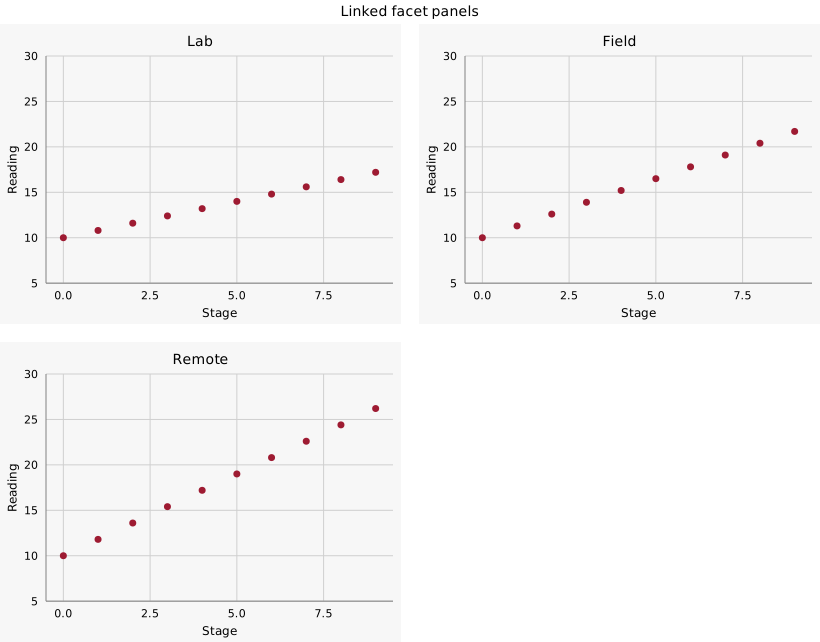
Styling and extensions · CS1

Mark styles and theme tokens

#

Rounded bars, a styled path and diamond markers use supported mark properties.

Mark styles and theme tokens, colorset1
Exact palette paintscartesian
Options and implementation

Style keys are validated against each mark kind. Browser DOM/CSS slots have a larger surface than native export; the API catalogue lists all 48 slots and their renderer support. Wedge gaps are demonstrated by the pie/donut example.

xy.chartxy.barxy.linexy.scatterxy.themexy.CHART_DOM_SLOTS

{
  "bar": [
    "style",
    "width"
  ],
  "line": [
    "style"
  ],
  "scatter": [
    "style"
  ],
  "x_axis": [
    "style"
  ]
}
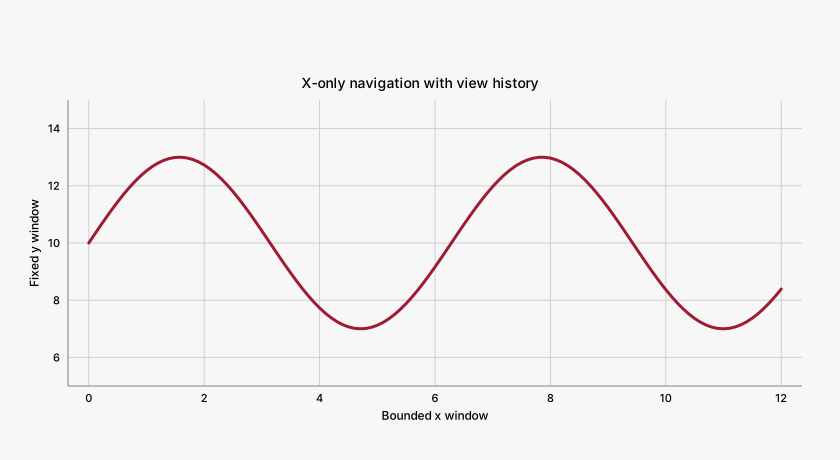
Styling and extensions · CS2

Mark styles and theme tokens

#

Rounded bars, a styled path and diamond markers use supported mark properties.

Mark styles and theme tokens, colorset2
Exact palette paintscartesian
Options and implementation

Style keys are validated against each mark kind. Browser DOM/CSS slots have a larger surface than native export; the API catalogue lists all 48 slots and their renderer support. Wedge gaps are demonstrated by the pie/donut example.

xy.chartxy.barxy.linexy.scatterxy.themexy.CHART_DOM_SLOTS

{
  "bar": [
    "style",
    "width"
  ],
  "line": [
    "style"
  ],
  "scatter": [
    "style"
  ],
  "x_axis": [
    "style"
  ]
}
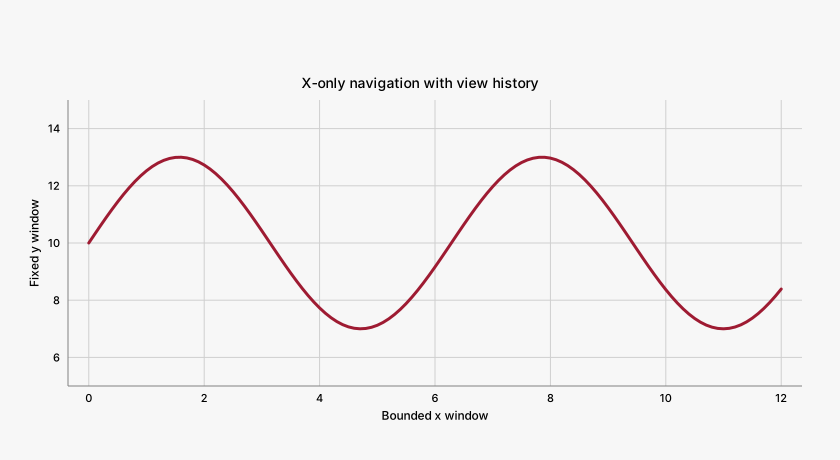
Styling and extensions · CS1

Extend XY by composing marks

#

A registered plugin normalizes columns and emits built-in line/scatter marks.

Extend XY by composing marks, colorset1
Exact palette paintscartesian
Options and implementation

The shipped extension point runs a Python calculation over declared columns and composes built-in marks one level deep. It does not install a custom WebGL shader. The portable source demonstrates registration, discovery and cleanup.

xy.MarkPluginxy.MarkContextxy.register_markxy.registered_marksxy.mark

{
  "MarkPlugin": [
    "name",
    "build",
    "columns",
    "calc",
    "doc"
  ],
  "register_mark": [
    "replace"
  ],
  "mark": [
    "data",
    "name",
    "fields"
  ]
}
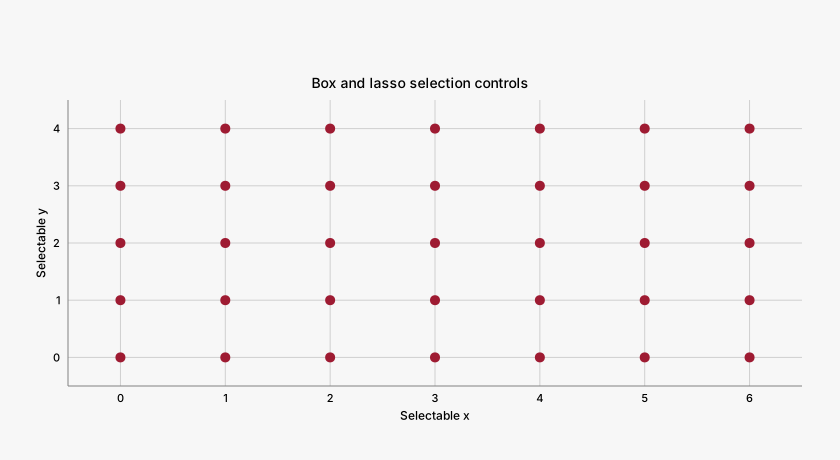
Styling and extensions · CS2

Extend XY by composing marks

#

A registered plugin normalizes columns and emits built-in line/scatter marks.

Extend XY by composing marks, colorset2
Exact palette paintscartesian
Options and implementation

The shipped extension point runs a Python calculation over declared columns and composes built-in marks one level deep. It does not install a custom WebGL shader. The portable source demonstrates registration, discovery and cleanup.

xy.MarkPluginxy.MarkContextxy.register_markxy.registered_marksxy.mark

{
  "MarkPlugin": [
    "name",
    "build",
    "columns",
    "calc",
    "doc"
  ],
  "register_mark": [
    "replace"
  ],
  "mark": [
    "data",
    "name",
    "fields"
  ]
}