Reflex XY · Palette study
Two color sets.
Six chart ideas.
The same data, the same geometry, a different visual voice. Explore six genuine XY chart mechanisms side by side in Color Set 1 and Color Set 2.
Explore more chart families, options, interactions and export recipes in the full XY capability atlas ↗.
01
Category scatter
Compare three cohorts
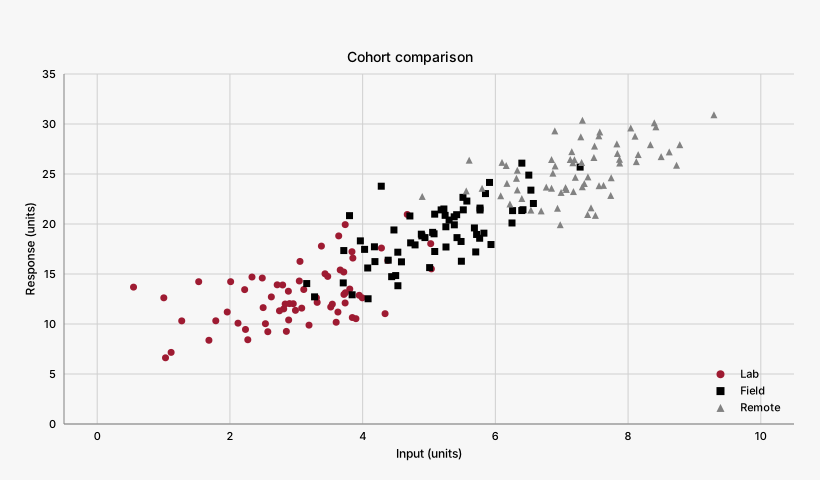
195 observations; shape and color identify the same three cohorts.
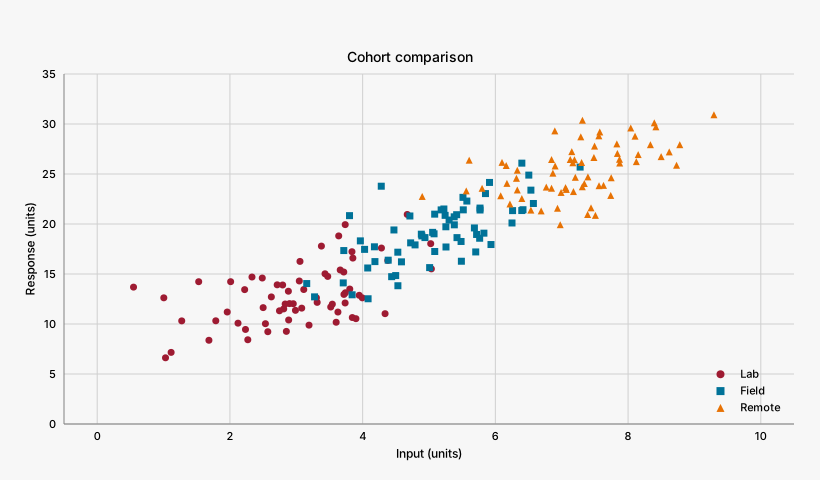
Each cohort keeps a separate mark, a direct color, and a matching legend entry. Circle, square, and triangle symbols provide a second cue.
02
Trend lines
Follow a change over time
Three weekly series; one missing observation stays visibly missing.
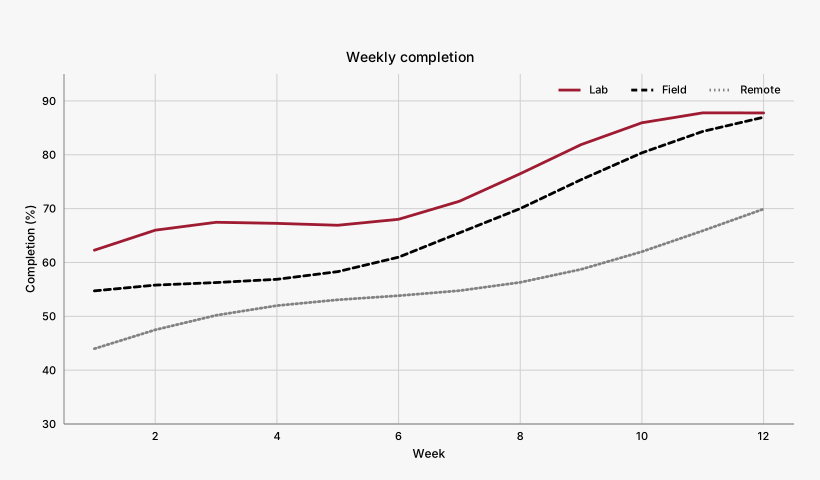
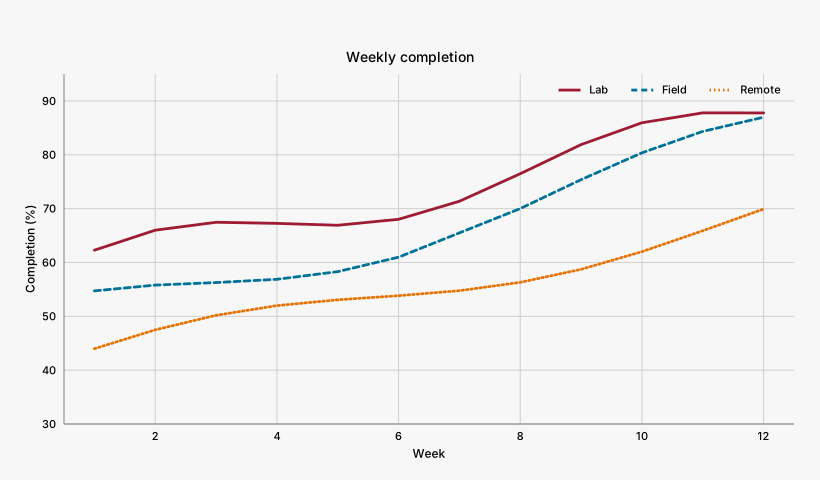
Line dashes repeat the series distinction. A missing week in the Field series remains a gap in both palette variants.
03
Grouped bars
Compare within each category
Three delivery channels across four regions, with a shared zero baseline.
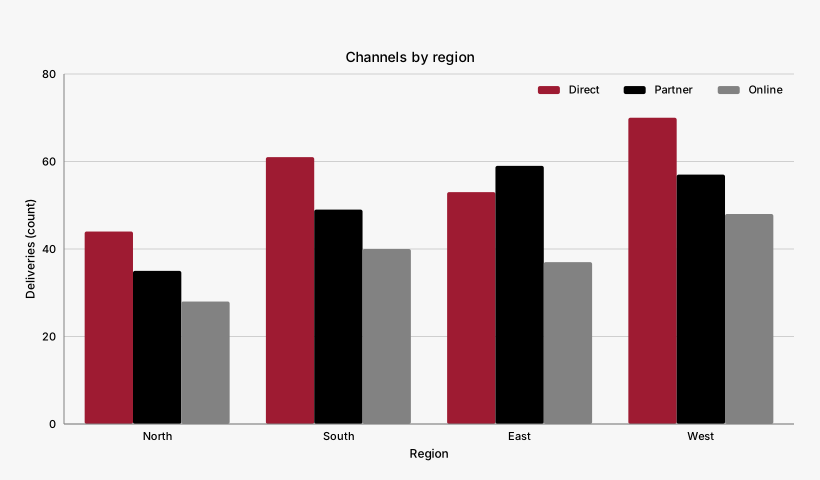
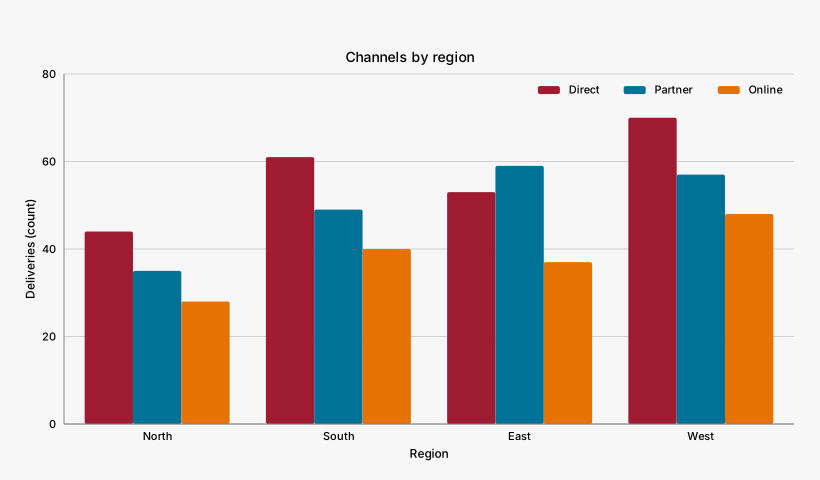
The same series matrix produces each group. Colors follow the channel order, so comparisons stay consistent across regions.
04
Histogram
Reveal the shape of a distribution
900 synthetic service times; the dashed line marks the sample median.
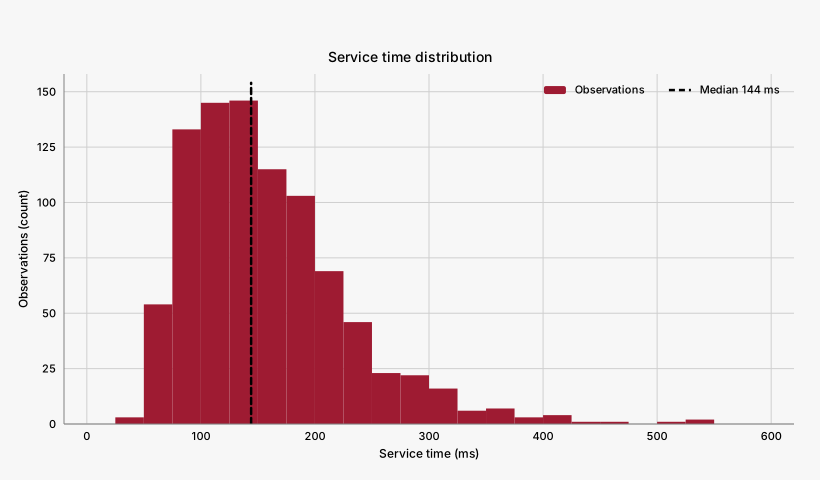
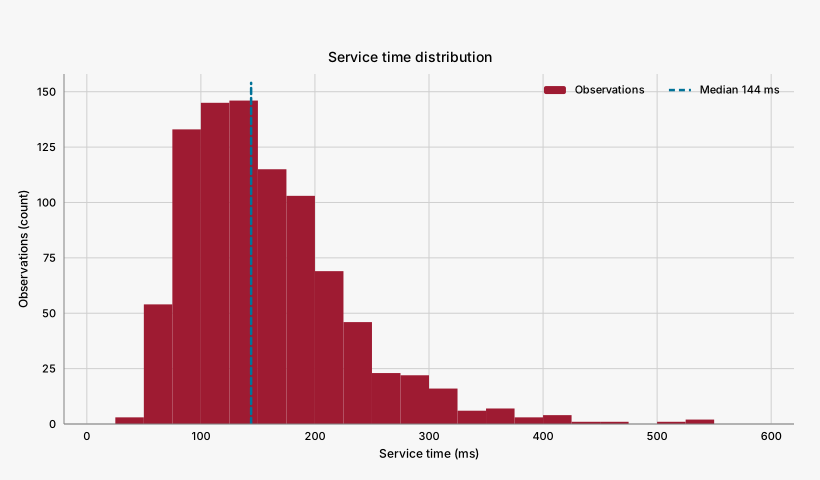
One solid palette color carries the distribution. The reference line adds a summary without replacing the individual bin counts.
05
Binned heatmap
Find patterns across two dimensions
A 7-by-12 synthetic workload matrix, divided into four fixed numeric bins.
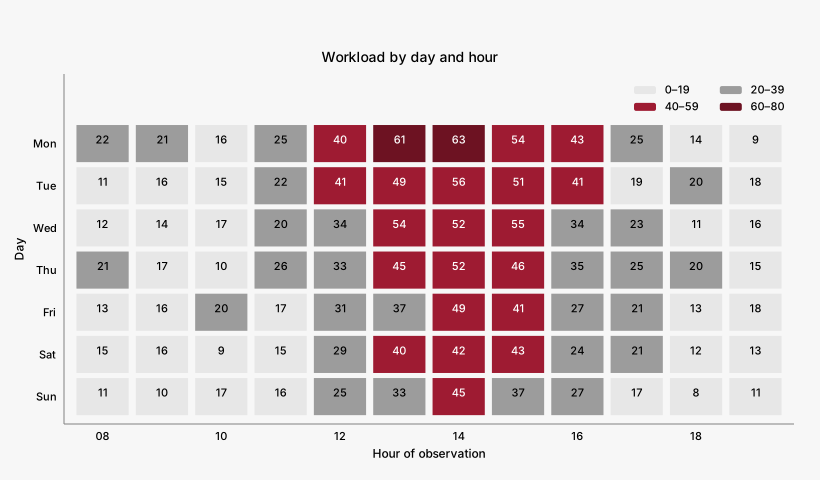
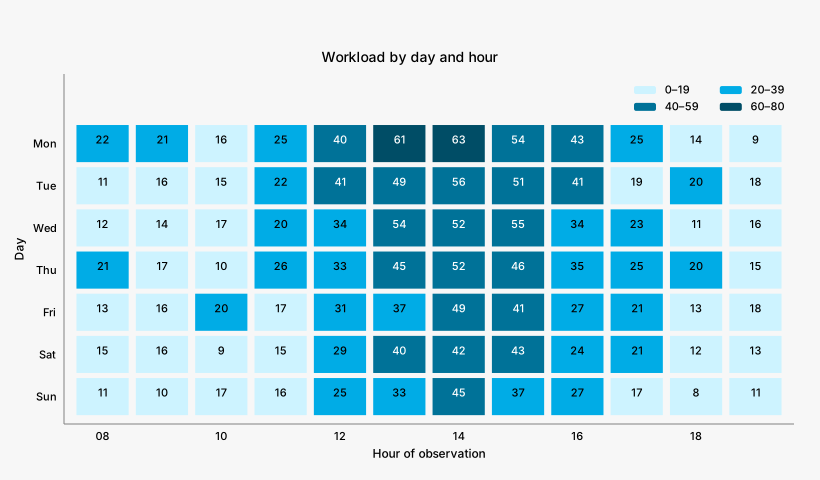
Data-unit rectangles use exact sequential colors with no gradient and resize with the canvas. Each cell displays its original workload; bin thresholds stay fixed at 0, 20, 40, 60, and 80.
06
Dense scatter
Reveal structure in a dense sample
8,000 synthetic observations drawn as opaque point marks.
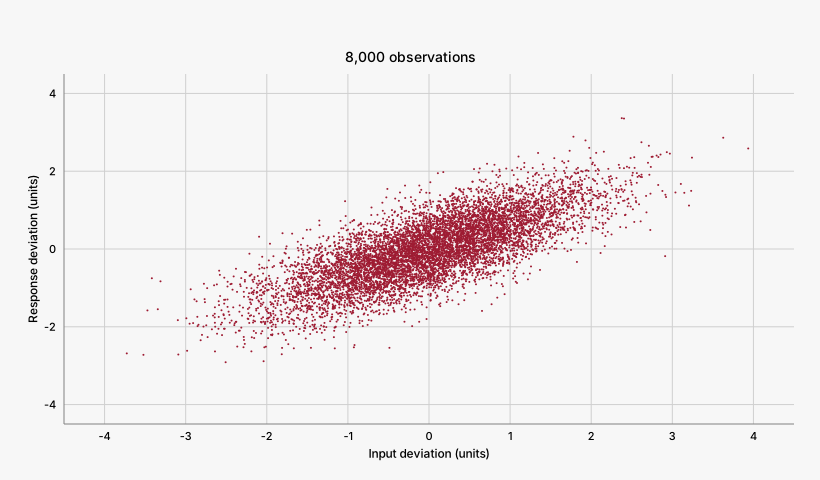
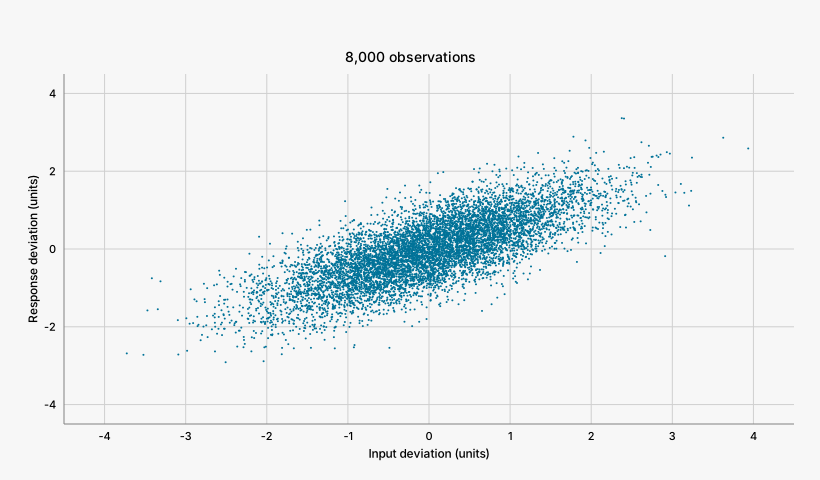
Small opaque markers retain exact palette fills. The footprint reveals concentration while every mark remains an individual point; automatic density aggregation is disabled.
Make it your own
All examples use synthetic data with a fixed seed. Each pair shares identical arrays, domains, dimensions, and marks. Download the five source files together and run:
uv run --script build.py --output-dir gallery
Keep the useful parts
SVG previews are native XY exports. Open HTML for a portable interactive snapshot with its data and client included. These examples use XY 0.0.8; the numeric matrix uses data-unit rectangle marks.
Inspect the example manifest for stable pattern IDs, palette definitions, and the common data fingerprint.